


- Download PDF
- |
- Download Citation
- |
- Email a Colleague
- |
- Share:
-
- Tweet
-
Journal of Diabetology and Endocrinology
Volume 1, Issue 2, August 2016, Pages 12–17
Original researchOpen Access
Protocol of the DiaDec-study: Quality of life, health care utilisation and costs in patients with diabetes: The role of depression
-
Tatjana Kvitkina1,2,*
 ,
Manuela Brüne2,
Nadezda Chernyak1,
Alexander Begun2,
Silke Andrich1,2,
Ute Linnenkamp2,
Annett Fiege1,
Heiner Claessen2,
Carina Emmel1,
Linda Jaffan-Kolb1,
Werner Arend1,
Imke Schmitz-Losem3,
Volker Fabricius3,
Johannes Kruse4 and
Andrea Icks1,2,5
,
Manuela Brüne2,
Nadezda Chernyak1,
Alexander Begun2,
Silke Andrich1,2,
Ute Linnenkamp2,
Annett Fiege1,
Heiner Claessen2,
Carina Emmel1,
Linda Jaffan-Kolb1,
Werner Arend1,
Imke Schmitz-Losem3,
Volker Fabricius3,
Johannes Kruse4 and
Andrea Icks1,2,5
*Corresponding author: Tatjana Kvitkina, MPH, MSc Epi, Paul-Langerhans-Group for Health Services Research and Health Economics, German Diabetes Center Düsseldorf at the Heinrich-Heine-University Düsseldorf, Leibniz-Centre for Diabetes Research, Auf'm Hennekamp 65, 40225 Düsseldorf, Germany. Tel.: +49-(0)-211-3382-408; Fax: +49-(0)-211-3382-677; E-mail: tatjana.kvitkina@ddz.uni-duesseldorf.de
Received 13 April 2016 Revised 6 July 2016 Accepted 18 July 2016 Published 27 July 2016
DOI: http://dx.doi.org/10.14312/2398-0281.2016-3
Copyright: © 2016 Kvitkina T, et al. Published by NobleResearch Publishers. This is an open-access article distributed under the terms of the Creative Commons Attribution License, which permits unrestricted use, distribution and reproduction in any medium, provided the original author and source are credited.
AbstractTop
Diabetes is a highly prevalent chronic disease with a substantial impact on quality of life and societal cost. Depressive disorders have been found to be more prevalent among individuals with diabetes than those without diabetes. Studies reported 4.5-times higher total annual healthcare costs for Medicare patients with comorbid diabetes and depression than for patients with diabetes but no comorbid depression. Data regarding the appropriateness of treatment and treatment outcomes in the real world setting for patients with diabetes and a depressive disorder is lacking. Our aim is to investigate the prevalence of undiagnosed and diagnosed depression and to describe health-related quality of life and health care utilisation and costs in a German sample of individuals with diabetes and comorbid depression. The DiaDec study is based on a random sample of a statutory health insurance (SHI) population with diabetes. In a baseline survey, participants were assessed with respect to subthreshold and major depression and health-related quality of life. Data on diagnosed depression, amount and cost of prescribed medications, and outpatient and inpatient care was extracted from health insurance records for each study participant. By linking the survey data with longitudinal health insurance data the association between depression status, quality of life and health care utilisation/costs in the year before and after the survey will be investigated. We expect that our results will foster discussion on the quality and cost-effectiveness of health care for patients with diabetes and a comorbid depression.
Keywords: diabetes; health insurance data; depression; health-related quality of life; health care costs
IntroductionTop
The prevalence of diabetes mellitus has increased substantially and reached 8.8% among adults (20-79 years) in 2015 corresponding to 415 million patients globally [1]. Studies have shown that the prevalence of depression is relatively high in patients with diabetes [2-5]. They have a 24% higher risk of developing depression than individuals without diabetes [6]. Extensive research demonstrates worse health outcomes and reduced health-related quality of life (HRQL) in patients with diabetes and comorbid depression when compared to patients with diabetes only [7]. Studies conducted in the USA also found higher overall health care costs for patients with depression and diabetes. This is mainly explained by the increased utilisation of general medical services rather than by mental health treatment costs alone. This association persisted even after accounting for comorbid medical conditions. Egede et al. [8] reported 4.5-times higher total annual healthcare costs for Medicare patients with comorbid diabetes and depression than for patients with diabetes alone ($247,000,000 and $55,000,000, respectively; P<0.0001 - cost adjusted to reflect the Dollar in August 2001). Furthermore, an analysis of Medicare claim data of recipients with diabetes by Unützer et al. [9] found that recipients with depression had higher total health care costs than those without depression ($20,046 vs $11,956; P<0.01).The economic burden of depression is not restricted to the health care system alone, since depression is associated with an increase in absence from work and disability days among patients with diabetes.
Data on health care utilisation and costs associated with depression in patients with diabetes is scarce. Data regarding the appropriateness of treatment, treatment outcomes, and the course of an untreated depressive disorder in the real world setting for patients with diabetes is lacking. Scientific knowledge on treatment patterns, health outcomes and costs among patients with diabetes and depression in usual care settings is needed to determine if and how quality and cost-effectiveness of health care can be improved for these patients.
Our aim is to investigate the prevalence of undiagnosed and diagnosed depression and to describe health-related quality of life and health care utilisation and costs in a German sample of individuals with diabetes and comorbid depression. In the following study protocol we describe the design and the methods of the study. The aims of the study are (i) To estimate the prevalence of depression (subthreshold and major depression), assessed using a standardised self-report instrument in patients with diabetes, and to determine factors (demographic characteristics, socioeconomic characteristics, and health status) associated with having a depression diagnosis in health insurance data and receiving treatment for depression. (ii) To analyse HRQL and diabetes-specific distress in patients with diabetes and depression, and those with diabetes alone, controlling for potentially relevant confounders such as diabetes severity and other comorbid illnesses. (iii) To compare health care utilisation patterns and costs among patients with diabetes with and without depression, controlling for potentially relevant confounders such as diabetes severity and other comorbid illnesses.
In participants with diagnosed depression (i.e. in patients with a diagnosis of depression in their health insurance data) we further intend: (i) To describe patterns of treatment for depression (frequency of antidepressant medication use, frequency of receiving non-pharmacological treatment). (ii) To evaluate the appropriateness of antidepressant treatment. (iii) To compare outcomes (HRQL and medical cost) in patients receiving recommended and less-than-recommended levels of treatment.
Materials and methodsTop
Study design
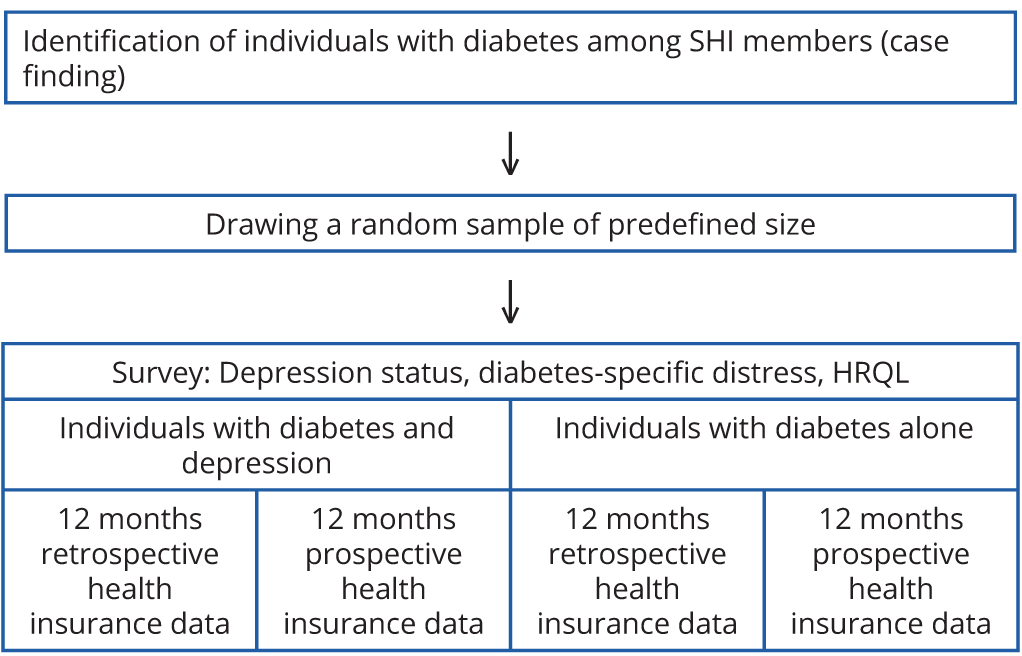
The study is a cross-sectional survey in a random sample of a health insurance population with diabetes including longitudinal health insurance data. Health insurance data on health care utilisation patterns and health care costs will be analysed for the period covering 12 months before and 12 months after the baseline survey. In the baseline survey, participants were assessed regarding subthreshold and major depression and HRQL. By linking survey data and health insurance data the association between depression status, HRQL and health care utilisation/costs will be investigated.
Study participants were recruited from insured persons of a statutory health insurance (SHI) covering 673,366 persons in Germany (pronova BKK). Figure 1 is a schematic diagram of the study design.
Study population and sampling
Patients with diabetes were identified among individuals insured by the SHI in February 2013 using the following criteria already applied in previous studies, e.g. Icks et al. [10]: (i) regular documentation of 10th International Classification of Diseases (ICD-10) diagnosis ‘diabetes’ (E10-E14) in three of four quarters in 2010 or (ii) regular prescription of antihyperglycaemic drugs (Anatomical-Therapeutic-Chemical [ATC] classification A10): at least two prescriptions within 2010 or (iii) a single prescription of an antihyperglycaemic drug within 2010 and a diagnosis of ‘diabetes’ or a single prescription of an antihyperglycaemic drug within 2010 and a blood glucose or HbA1c measurement in the same quarter.
Insured persons were not selected if they met the following exclusion criteria: younger than 18 or older than 80 years, in the care of a legal guardian, long term care level 2 or 3, documented ICD-10 code F70 to F79 (intellectual debility) or Z51.5 (palliative therapy).
Potential study participants (n = 46.566) were randomly mixed without considering any characteristics and were subsequently allocated a random ID. For the random sample, the first 4,053 persons were invited to participate in the study. They were contacted by post with one reminder letter after three to eight weeks if there was no response and further contacted by telephone after further three to seven weeks with at least two calls. The invitation included all elements of informed consent (study purpose, voluntary nature of participation) as well as a separate specific request for the use of the participant’s health insurance records. In total 3,644 persons were eligible to participate in the study. 1,860 persons sent back the questionnaire and gave consent to use their health insurance data.
Calculation of power
The sample size calculation was based on the primary outcome "total cost". We assumed the following: (i) the prevalence of depression (including "subthreshold depression") in the population with diabetes is around 20% [2], (ii) the log-transformed costs are normally distributed with the standard deviation of 1.3 in both populations (individuals with diabetes and with or without depression). The latter assumption was based on data regarding health care costs by Simon et al. [11]. Given these assumptions, we had to include 1,670 participants in our analyses to be able to discover 25% higher health care costs in individuals with diabetes and comorbid depression than in individuals with diabetes alone with a level of significance (α) of 5% and a power of 80%. Assuming a response of 50%, about 4,000 insured people were invited to participate in the study.
Data collection
Assessment of depression
The Patient Health Questionnaire (PHQ-9) was used to estimate the prevalence of subthreshold and major depression. The PHQ-9 questionnaire provides major and minor (subthreshold) depression diagnoses according to the Diagnostic and Statistical Manual of Mental Disorders, 4th Edition (DSM-IV) criteria and a continuous severity score. The PHQ-9 diagnosis has high compliance with a major depression diagnosis based on structured interviews [12]. The criteria for major depression required the patient to have, for the last two weeks, five or more depressive symptoms present for more than half of the days. At least one of these main symptoms must be depressed mood or anhedonia. To meet the criteria for minor depression (subthreshold depression, psychological distress), patients must have, for the last two weeks, two to four symptoms present for more than half the days, with at least one of the main symptoms being either depressed mood or anhedonia.
We also used the short form of the Center for Epidemiological Studies Depression Scale (CES-D) with 15 items using a cut-off value of ≥17, as defined in other validation studies [13]. CES-D identifies patients with clinical depression and has a sensitivity of 91.8% and a specificity of 83.9% [14]. This well established instrument has been used in a number of studies which analysed the association between diabetes and depression.
Diabetes-specific distress
Diabetes-specific distress was assessed using the Problem Areas in Diabetes Scale (PAID), a 20-item questionnaire in which each item represents a unique area of diabetes-related psychosocial distress [15]. Every item is rated on a six-point Likert scale, reflecting the degree to which the item is perceived as currently problematic (1 = not a problem to 6 = a serious problem). The PAID summary score was transformed into a 0–100 scale, with higher scores reflecting greater disability (emotional distress).
Health-related quality of life
Health-related quality of life was measured by using the self-reported health status composed of 12-items and covering the previous four weeks of a respondent’s life (SF-12 Health Survey form) [16]. The SF-12 contains one or two items for the following eight health dimensions: physical functioning, role functioning, bodily pain, general health perception, energy/vitality, social functioning, emotional functioning, and mental health. The SF-12 consists of two scales: the physical component summary score (PCS-score), indicating ‘physical’ quality of life, and the mental component summary score (MCS-score), indicating ‘mental’ quality of life.
Sociodemographic characteristics
Age, sex, marital status (married/single, divorced, separated, widowed), household (with/without partner) and origin (resident in Germany since birth/not resident in Germany since birth) were assessed in the baseline survey. Employment and retirement status were also assessed.
Socioeconomic status
Education was assessed according to the International Standard Classification of Education [17] as total years of formal education, combining school and vocational training. The continuous variable was grouped into three categories, with the highest category of 14 or more years of education and the lowest category of 10 or less years (equivalent to a basic school degree and no vocational training).
The following data was obtained from health insurance records (12 months preceding the survey and 12 months following). The anonymity of the patient data retrieved was guaranteed by using pseudonyms.
Health care utilisation and cost
Data on the amount and cost of prescribed medications and outpatient and inpatient care was extracted from health insurance records for each study participant. Psychological and emergency treatments were recorded specifically for each study participant and were afforded special emphasis.
Comorbidity
Comorbidity was assessed on the basis of diagnostic groupings, which are used in Germany for morbidity-oriented risk structure adjustment by health insurance funds (morbiditätsorientierter Risikostrukturausgleich “Morbi RSA” [18]). This system covers 80 severe or costly and chronic diseases structured in a system of hierarchical groups. We used the number of coded morbidity groups.
Diabetes-specific measures/diabetes severity
The type and duration of diabetes (years since diagnosis) and insulin treatment of diabetes were assessed using survey data and health insurance records. ICD-10 codes for seven types of diabetes complications (retinopathy, nephropathy, neuropathy, cerebrovascular, cardiovascular, peripheral vascular, and metabolic) were used to identify the presence of specific complications by calculating the adapted Diabetes Complications Severity Index (aDCSI) with the range 0-13 [19].
Diagnosed and treated depression
Diagnosed depression
At least one of the following criteria is required: (i) an ICD-10 code for the diagnosis of depression (F32.0-F32.9, F33.0-F33.9, F34.1, F38.1 and F41.2) or (ii) treatment with a serotonin reuptake inhibitor, bupropion, venlafaxine, mirtazapine, agomelatine, tianeptine or trazodone over the 12 months period before or 12 months after the baseline assessment (these drugs are used for validation if a diagnosis is not present). Tricyclic antidepressants and mood stabilisers are not included as a proxy of recognition due to their frequent use for insomnia, painful neuropathy or other non-depression related indications.
Treated depression
At least one of the following criteria is required: (i) one specific mental health or psychotherapy visit (ambulatory or inpatient) or (ii) one of the N06A-ATC codes for antidepressant therapy.
Adequacy of depression treatment
Following evidence-based treatment guidelines [20], we defined the following information from the health insurance data as representing an adequate depression treatment: within the 12 months before or 12 months after the baseline screening, participants with a diagnosis of depression received either (i) at least 4 outpatient visits with any type of physician for pharmacotherapy that includes the use of either an antidepressant or mood stabiliser for a minimum of 30 days or (ii) at least 8 outpatient visits with any specialist in psychotherapy for mental health lasting at least 30 min each.
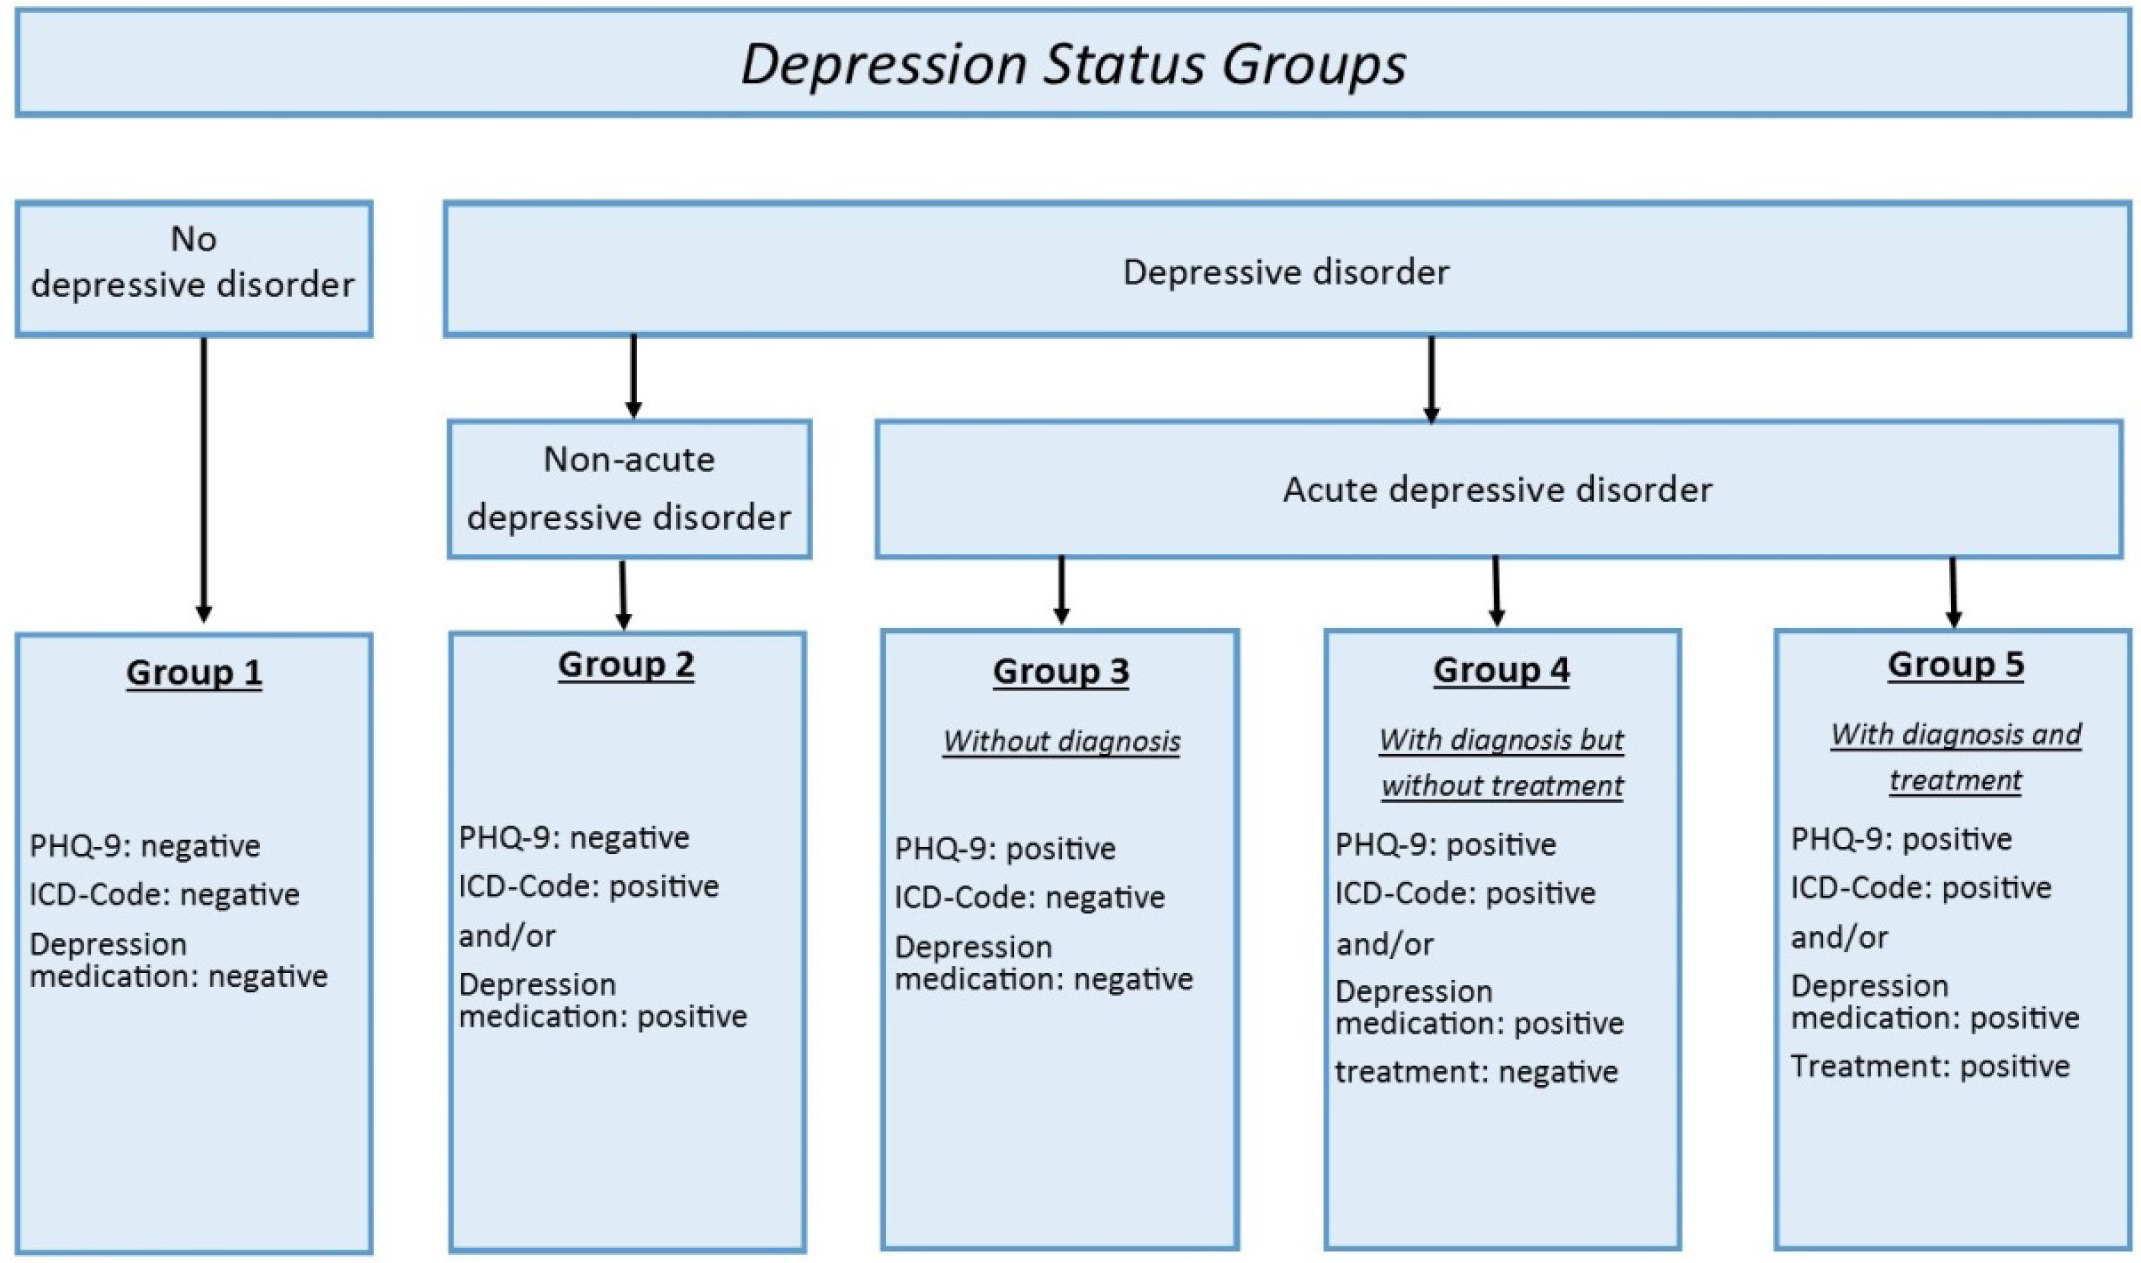
Depression status according to self-reports and health insurance data
We defined five subgroups for the assessment of depression status (Figure 2). Everyone without self-reported depressive disorder or a diagnosis in health insurance data belongs to group one. Patients with a diagnosis in health insurance data but no self-reported depressive disorder belong to group two. The third group consists of patients with self-reported depressive disorder but neither a diagnosis nor treatment for depression according to health insurance data. The fourth group consists of patients with self-reported depressive disorder who also have a diagnosis in health insurance data but who have not received treatment. Patients with self-reported and diagnosed depression who also received treatment according to health insurance data constitute group five (Figure 2).
Methods against bias
Obtaining a good response rate is central to valid results. A number of strategies were employed to enhance response rates. For instance, reminders were sent out if the first contact was not successful. We examined differences in the identified data between survey responders and non-responders using automated health care data on the basis of anonymised data. Based on these differences we will estimate the response propensity scores (probability of being a responder) as a function of the following variables (all of these within the year prior to the baseline assessment): age, gender, place of residence (German federal land and administrative district), employment status, medical costs (medication, outpatient and inpatient treatment), treatment with insulin, use of oral hypoglycaemic medicines, depression diagnosis and other comorbidity by number of coded morbidity groups. We will predict response/non-response status as a function of these variables using logistic regression. Using these predictors, we will estimate a response probability for each survey responder (response propensity score). In a sensitivity analysis we will use a weighted logistic regression analysis (weights inversely proportional to estimated probability of response) rescaled to the observed sample size (i.e., number of survey responders). In a weighted analysis, individuals with a low probability of responding will be given a higher weight in the analysis to represent the larger number of non-responders with similar characteristics. This procedure allows the responder sample to be “weighted” to the population receiving the mail survey.
Statistical methods
Main analysis
Firstly, the prevalence of subthreshold and major depression (proportion with 95% confidence interval (CI)) will be estimated by using the baseline self-report (PHQ-9 questionnaire). Patients with diabetes either with or without comorbid depression will be described using the following characteristics: age, sex, marital status, level of education, origin, comorbidities (based on Morbi RSA), diabetes severity, frequency of health care utilisation, and health care costs. The continuous variables will be described using mean values and standard deviations (SDs), while all categorical variables described used percentages with 95% CI. Health-related quality of life will be assessed by using the SF-12 questionnaire with the PCS-score and MCS-score. Differences regarding the HRQL between the groups with and without self-reported depression will be estimated by using the Wilcoxon test. The factors associated with reduced HRQL will be analysed on linear regression models. Diabetes-specific distress will be analysed using PAID.
Additionally, a comparison of the groups identified as having self-reported depression using PHQ-9 or CES-D will be conducted to evaluate the differences between the two groups. We will therefore analyse how the groups identified by the two instruments differ in terms of their health status and sociodemographic factors. Mean values and SDs will be used to describe continuous variables. For all categorical variables, we will use percentages with 95% CI. Furthermore, we will use a Chi-squared test for categorical variables and a Kruskal-Wallis test for continuous variables to test for differences.
By linking primary and secondary data, the proportion of patients in each of the five groups described previously will be calculated. Relevant sociodemographic variables and clinical variables (diabetes severity, comorbidity, health care utilisation) will be evaluated as potential predictors for belonging to either of the five groups.
Since PHQ-9 is a cross-sectional measure of depression and there is no information about the course of depression before and after the baseline assessment, average health care utilisation and costs over 2 years, i.e. in the year prior to and the year after baseline assessment, will be estimated for the five groups based on depression status (Figure 2). Use of this two-year average will also reduce the number of patients with no health care utilisation/costs, simplifying the statistical analysis of health care costs and utilisation. Because of the right skewed distribution of these measures, 95% CI for the mean values and percentages of health care utilisation will be estimated using bootstrap procedures [21]. Costs of previous years will be inflated to 2014 using the German Consumer Price Index [22]. We will use a student’s t-test to compare mean log-transformed health care utilisation and expenditures to examine the differences between different groups of individuals with and without depression (Figure 2). Multiple regression analyses will be used to estimate the associations between mean total direct health care costs, costs of inpatient/outpatient treatment, or medication costs as dependent variables, and depression stage as the main independent variable. Expected cost ratios (CRs) for the whole study population will be estimated by combining both parts of the model using generalized linear models (1st poisson regression model with robust error variance [23, 24], 2nd gamma regression model).
To assess the association of HRQL with depression status, the generalized linear model will be applied to physical and mental component scores from the SF-12.
Explorative analysis of the appropriateness of treatment
Within the explorative analysis we will describe the patterns of depression treatment by reporting the frequency of antidepressant medication use as well as the frequency of non-pharmacological treatment. Furthermore, a comparison shall be made of the outcomes of individuals treated according to the guidelines to those whose treatment did not conform to guidelines.
This will be done by examining how HRQL, health care utilisation (inpatient, outpatient, medication and others), and costs (inpatient, outpatient, medication and others) differ among these two groups. Moreover, the appropriateness of treatment will be evaluated in the subgroup receiving treatment.
ConclusionTop
As far as we know this is the first study to investigate the prevalence of undiagnosed and diagnosed depression, health-related quality of life, and health care utilisation and costs in a German sample of individuals with diabetes. The strength of our study is the link between health insurance data, which documents health care services received and their associated costs, to self-reported data on depression. This link will allow us to estimate the prevalence of recognized/treated depression and to compare outcomes (HRQL and medical cost) of treated and untreated depression.
Funding
The study has received a grant from a major funding body the German Federal Ministry of Education and Research (BMBF, No. 01GY1133), the granting of which has involved peer review of the proposed research.
Conflicts of interest
The authors declare no conflicts of interest.
ReferencesTop
[1]International Diabetes Federation. IDF diabetes atlas - 7th edition. 2015.Article
[2]Ali S, Stone MA, Peters JL, Davies MJ, Khunti K. The prevalence of co-morbid depression in adults with Type 2 diabetes: a systematic review and meta-analysis. Diabet Med. 2006; 23(11):1165-1173.Article Pubmed
[3]Icks A, Kruse J, Dragano N, Broecker-Preuss M, Slomiany U, et al. Are symptoms of depression more common in diabetes? Results from the Heinz Nixdorf Recall study. Diabet Med. 2008; 25(11):1330-1336.Article Pubmed
[4]Wagner G, Icks A, Redaelli M, Albers B, Abholz HH. Association of diabetes type 2 and depression - behavioural and biological aspects. Dtsch Med Wochenschr. 2014; 139(8):369-374.Article Pubmed
[5]Atlantis E, Fahey P, Foster J. Collaborative care for comorbid depression and diabetes: a systematic review and meta-analysis. BMJ Open. 2014; 4(4):1-10.Article Pubmed
[6]Nouwen A, Winkley K, Twisk J, Lloyd CE, Peyrot M, et al. Type 2 diabetes mellitus as a risk factor for the onset of depression: a systematic review and meta-analysis. Diabetologia. 2010; 53(12):2480-2486.Article Pubmed
[7]Schram MT, Baan CA, Pouwer F. Depression and quality of life in patients with diabetes: a systematic review from the European depression in diabetes (EDID) research consortium. Curr Diabetes Rev. 2009; 5(2):112-119.Article Pubmed
[8]Egede LE, Zheng D, Simpson K. Comorbid depression is associated with increased health care use and expenditures in individuals with diabetes. Diabetes care. 2002; 25(3):464-470.Article Pubmed
[9]Unutzer J, Schoenbaum M, Katon WJ, Fan MY, Pincus HA, et al. Healthcare costs associated with depression in medically Ill fee-for-service medicare participants. J Am Geriatr Soc. 2009; 57(3):506-510.Article Pubmed
[10]Icks A, Haastert B, Trautner C, Giani G, Glaeske G, et al. Incidence of lower-limb amputations in the diabetic compared to the non-diabetic population. findings from nationwide insurance data, Germany, 2005-2007. Exp Clin Endocrinol Diabetes. 2009;117(9):500-4.Article Pubmed
[11]Simon GE, Katon WJ, Lin EH, Ludman E, VonKorff M, et al. Diabetes complications and depression as predictors of health service costs. Gen Hosp Psychiatry. 2005; 27(5):344-351.Article Pubmed
[12]Kroenke K, Spitzer RL, Williams JB. The PHQ-9: validity of a brief depression severity measure. J Gen Intern Med. 2001; 16(9):606-613.Article Pubmed
[13]Hautzinger M, Bailer M, Hofmeister D, Keller FH, Gottingen. Allgemeine Depressionsskala (ADS). Manual (2. Aufl). Hogrefe; 2012.Article
[14]Lehr D, Hillert A, Schmitz E, Sosnowsky N. Screening depressiver störungen mittels Allgemeiner Depressions- Skala (ADS-K) und State- Trait Depression Scales (STDS-T). Eine vergleichende evaluation von cut-off-werten. 2008.Article
[15]Hermanns N, Kulzer B, Krichbaum M, Kubiak T, Haak T. How to screen for depression and emotional problems in patients with diabetes: comparison of screening characteristics of depression questionnaires, measurement of diabetes-specific emotional problems and standard clinical assessment. Diabetologia. 2006; 49(3):469-477.Article Pubmed
[16]Ware J, Jr., Kosinski M, Keller SD. A 12-Item Short-Form Health Survey: construction of scales and preliminary tests of reliability and validity. Med Care. 1996; 34(3):220-33.Article Pubmed
[17]UNESCO. International Standard Classification of Education ISCED. 1997.Article
[18]Buchner F, Goepffarth D, Wasem J. The new risk adjustment formula in Germany: implementation and first experiences. Health policy. 2013; 109(3):253-262.Article Pubmed
[19]Chang HY, Weiner JP, Richards TM, Bleich SN, Segal JB. Validating the adapted Diabetes Complications Severity Index in claims data. Am J Manag Care. 2012; 18(11):721-726.Article Pubmed
[20]AWMF. S3-Leitlinie/Nationale VersorgungsLeitlinie Unipolare Depression, Langfassung. In: Version 5, November 2009, zuletzt geändert: Juni 2015.Article
[21]Efron B, Tibshirani R. An introduction to the bootstrap. New York: 1994.Article
[22]Statistisches Bundesamt. Verbraucherpreisindex für Deutschland. 2015.Article
[23]Zou G. A modified poisson regression approach to prospective studies with binary data. Am J Epidemiol. 2004; 159(7):702-706.Article Pubmed
[24]McNutt LA, Wu C, Xue X, Hafner JP. Estimating the relative risk in cohort studies and clinical trials of common outcomes. Am J Epidemiol. 2003; 157(10):940-943.Article Pubmed
 Copyright
© 2012-2025 NobleResearch Group. All Rights Reserved
Copyright
© 2012-2025 NobleResearch Group. All Rights Reserved