


- Download PDF
- |
- Download Citation
- |
- Email a Colleague
- |
- Share:
-
- Tweet
-
Journal of Modern Human Pathology
Volume 1, Issue 3, July 2016, Pages 25–34
Original researchOpen Access
ROS1 gene rearrangement and expression of splice isoforms in lung cancer, diagnosed by a novel quantitative RT-PCR assay
-
Kalla C1,*
 ,
Gruber K1,
Rosenwald A2,
Kimmich M3,
Kohlhäufl M3,
Friedel G3 and
Ott G1
,
Gruber K1,
Rosenwald A2,
Kimmich M3,
Kohlhäufl M3,
Friedel G3 and
Ott G1
*Corresponding author: Dr. Claudia Kalla, Dr. Margarete Fischer-Bosch Institute of Clinical Pharmacology, Auerbachstr 112, 70376 Stuttgart, Germany. Tel.: +49-711-8101-5003; Fax: +49-711-859295; E-mail: claudia.kalla@ikp-stuttgart.de
Received 19 May 2016 Revised 13 June 2016 Accepted 22 June 2016 Published 29 June 2016
DOI: http://dx.doi.org/10.14312/2397-6845.2016-5
Copyright: © 2015 2016 Kalla C, et al. Published by NobleResearch Publishers. This is an open-access article distributed under the terms of the Creative Commons Attribution License, which permits unrestricted use, distribution and reproduction in any medium, provided the original author and source are credited.
AbstractTop
Successful treatment of lung cancer (NSCLC) patients with ROS1 inhibitors depends on the accurate diagnosis of ROS1 gene rearrangements. The approved FISH tests are low-throughput assays difficult to use in daily diagnostic practice. Immunohistochemistry is currently discussed as screening test. We aimed to devise an alternative, sensitive diagnostic test for the rearrangement of ROS1 and to investigate upregulated ROS1 gene expression as potential target in NSCLC. We developed a qRT-PCR assay adapted to RNA isolated from FFPE material and applied it to 695 NSCLC specimens. The reliability to detect ROS1 rearrangements was evidenced by comparison with FISH and immunohistochemistry. qRT-PCR analysis detected unbalanced ROS1 expression indicative of gene rearrangement in 5 (0.7%) and expression of non-rearranged ROS1 transcripts in 65 (9.6%) of 680 interpretable tumors. In comparison with FISH, qRT-PCR accurately typed 99% of 5 rearranged and 121 non-rearranged tumors. Immunohistochemistry detected ROS1 protein expression in 7/8 tumors with gene fusions and 6/35 NSCLC with transcriptional upregulation. To elucidate RNA processing, 12 NSCLC were examined by systematic RT-PCR and sequence analysis. In all 12 NSCLC analyzed, up-regulated gene expression independent of translocation was associated with aberrant expression of fetal transcript isoforms identified here. We conclude that our qRT-PCR assay reliably diagnoses and distinguishes ROS1 rearrangements and expression of non-rearranged transcripts. Immunostaining is a suitable screening tool, but re-examination of ROS1 protein expressing cases by qRT-PCR/FISH is compulsory. The expression of ROS1 splice isoforms – shown here for the first time - may be relevant for ROS1 inhibitor therapy in NSCLC.
Keywords: ROS1; non-small cell lung cancer (NSCLC); routine diagnostics; qRT-PCR; translocation; overexpression; splice isoforms
IntroductionTop
ROS1 gene rearrangements define a rare but clinically important subset of non-small-cell lung cancer (NSCLC). The ROS1 oncogene encodes an orphan receptor tyrosine kinase (RTK) related to the anaplastic lymphoma receptor tyrosine kinase (ALK) [1]. Genomic rearrangements of ROS1 with one of 12 fusion partners create fusion proteins with a constitutively active kinase domain of ROS1 driving cellular proliferation [2-4]. In lung adenocarcinoma cells, signaling of the activated tyrosine kinase can effectively be inhibited by the small molecule inhibitor crizotinib [5, 6]. Accordingly, crizotinib showed marked antitumor activity in patients with ROS1-rearranged NSCLC [7].
ROS1 rearrangements occur in approximately 1% of patients with NSCLC, and reliable pre-selection by clinical or histopathological criteria is not effective so far [8]. A rapid screening for the identification of those few NSCLC patients with ROS1 rearrangements is desirable. Thus, the development of robust and reliable, but also rapid and cost-effective laboratory tests is of importance. Currently, fluorescence in situ hybridization (FISH) is the approved diagnostic test to detect ROS1 rearrangement which, however, requires specialized technical equipment, expertise and generally is a low-throughput approach. Immunohistochemistry (IHC) - rapid and perfectly adapted for routine pathology practice -has been proposed as an alternative. Immunostaining of the ROS1 protein detects ROS1 rearrangement with high sensitivity [9, 14]; however, protein expression was also observed in the absence of gene fusion in 4-30% NSCLC [9, 10, 13, 15]. Although the function of ROS1 gene fusions is understood to some extent, to date, the molecular mechanisms and pathogenetical implications of the expression of non-rearranged ROS1 are fairly unknown.
Recently, we have developed a sensitive and robust routine diagnostic test that uses quantitative reverse transcription PCR (qRT-PCR) to identify ALK rearrangements by detecting unbalanced ALK transcript expression [16]. The aim of the present study was to devise an equivalent diagnostic assay for the detection of ROS1 rearrangements in formalin-fixed paraffin-embedded (FFPE) samples based on qRT-PCR. This approach was applied to a large cohort of routine lung cancer specimens (i) to determine the reliability of the assay to detect ROS1 rearrangements in comparison with FISH and IHC, and (ii) to quantify the prevalence of transcriptional upregulation of ROS1 in NSCLC in relation to copy number gains and protein expression patterns.
Materials and methodsTop
Specimen collection
FFPE diagnostic biopsies or resection specimens from 739 patients diagnosed with NSCLC according to the WHO classification for lung tumors [17] - enriched for cases with good RNA quality determined in a previous qRT-PCR study [16] - and mRNA isolated from fetal lung (BioCat, Heidelberg, Germany) were included in this study. The study was approved by the Ethics Committee of the University Hospital, Eberhard-Karls-Universität Tübingen, Germany (299/2012BO2). Glioblastoma cell lines U-118MG and U-343MG (CLS, Eppelheim, Germany) were used as positive controls for the expression of FIG-ROS1 and full-length ROS1 transcripts, respectively.
RNA and DNA preparation
Total RNA and genomic DNA were isolated from FFPE tissue samples by using the AllPrep DNA/RNA FFPE Kit as described by the manufacturer (Qiagen, Hilden, Germany). This extraction method was optimized by the manufacturer to reverse formaldehyde modification without further RNA degradation. Total RNA and genomic DNA were isolated from cell lines by using the AllPrep DNA/RNA Mini Kit (Qiagen).
Quantitative reverse transcription PCR
For each sample, 1 µg total RNA was reversely transcribed using random hexamers and the SuperScript-First strand synthesis system for RT-PCR (Life Technologies, Darmstadt, Germany). Primers for quantitative RT-PCR (qRT-PCR) targeting the 5’ and the 3’ portions of the ROS1 transcript (exons 15/16, 17/18, and 40/41) were designed based on published sequence data (NM_002944.2; Supplementary Table 1). qRT-PCR was carried out in a 7900HT Fast Real-Time PCR system by using the SYBR Green PCR kit (Life Technologies) as described earlier [16]. ROS1 expression was normalized to the expression of PGK1 (ΔCT calculation), which had been proven to represent a suitable internal control for normalizing NSCLC samples.
PCR and DNA sequence analysis
The ROS1 kinase domain (exons 36-42) and exon 43 were searched for mutations by direct sequencing of PCR products amplified from genomic DNA, the 5’ portion of ROS1 transcripts by sequence analysis of RT-PCR products using standard PCR conditions and cycle sequencing with ABI PRISM BigDye Terminator chemistry (Perkin Elmer, Rodgau, Germany) [16]. Primer sequences are shown in Supplementary Table 1.
Fluorescence in situ hybridization
FISH was done on 4-µm thick FFPE tissue sections according to published protocols [18]. Experiments were evaluated using an epifluorescence microscope (Leica DMRA, Wetzlar, Germany). Images were captured using an Isis workstation (Version 5.4, Metasystems, Altlussheim, Germany). ROS1 rearrangements were analyzed using the ZytoLight ROS1 Dual Color Break Apart Probe (ZytoVision GmbH, Bremerhaven, Germany). Signal evaluation was performed on at least 100 nuclei. Cases were regarded as FISH-positive if (i) separated green and orange signals (translocation) or (ii) single green signals (translocation and deletion of the ROS1 5’ portion) were identified in at least 15% tumor cells.
Immunohistochemistry
IHC was accomplished on 3-µm thick FFPE tissue sections (tissue microarrays consisting of triplicate 0.6 mm cores; full tissue sections) using the Leica BOND MAX system (Menarini Diagnostics, Berlin, Germany) with conventional DAB staining. After heat-induced epitope retrieval at pH 9.0 rabbit monoclonal ROS1 antibody D4D6 (1:250; cell signaling Danvers, USA) was incubated for 30 min, followed by washing and detection according to the manufacturer’s protocol. ROS1 IHC was scored by estimating the intensity of cytoplasmic staining: 0/negative, no staining; 1+, weak; 2+, moderate; 3+, strong staining intensity in at least 10% tumor cells.
EGFR and ALK status
ALK rearrangement status was determined by qRT-PCR and confirmed by break-apart FISH as described earlier [16]. EGFR sequence analysis was performed as reported using the therascreen EGFR RGQ PCR Kit (Qiagen) [19, 20].
Statistical analysis and prediction programs
For all calculations, Analyse-it software (Leeds, United Kingdom) for Microsoft Excel was used. Prediction of translation initiation sites was performed using the algorithms ATGpr_sim (http://atgpr.dbcls.jp/) [21] and NetStart 1.0 (http://www.cbs.dtu.dk/services/NetStart/) [22].
ResultsTop
Establishment of the ROS1 qRT-PCR assay
Rearrangement of ROS1 results in the expression of the 3’ part of ROS1 encoding the kinase domain (exons 36-42), while the ROS1 5’ portion (exons 1-31) remains quiescent. We developed a qRT-PCR assay consisting of two amplicons targeting the 5’ portion (5’-A1: exons 15/16, 5’-A2: exons 17/18) and one amplicon specific for the 3’ part of the ROS1 transcript (3’: exons 40/41; Figure 1). To overcome the technical problems associated with the use of fragmented FFPE RNA small amplicons (71-81 bp in size) and an RNA isolation method optimized to reverse formaldehyde modification without further RNA degradation were employed. The functional capability of the ROS1 assay was assessed by studying cell line U-118MG harboring a FIG-ROS1 translocation in comparison with U-343MG expressing full-length ROS1 transcripts. While both 5’ and 3’ exons were expressed in U-343MG, an unbalanced ROS1 transcript expression was seen in U-118MG with expression of the 3’ exons while the 5’ exons were not expressed (not shown).
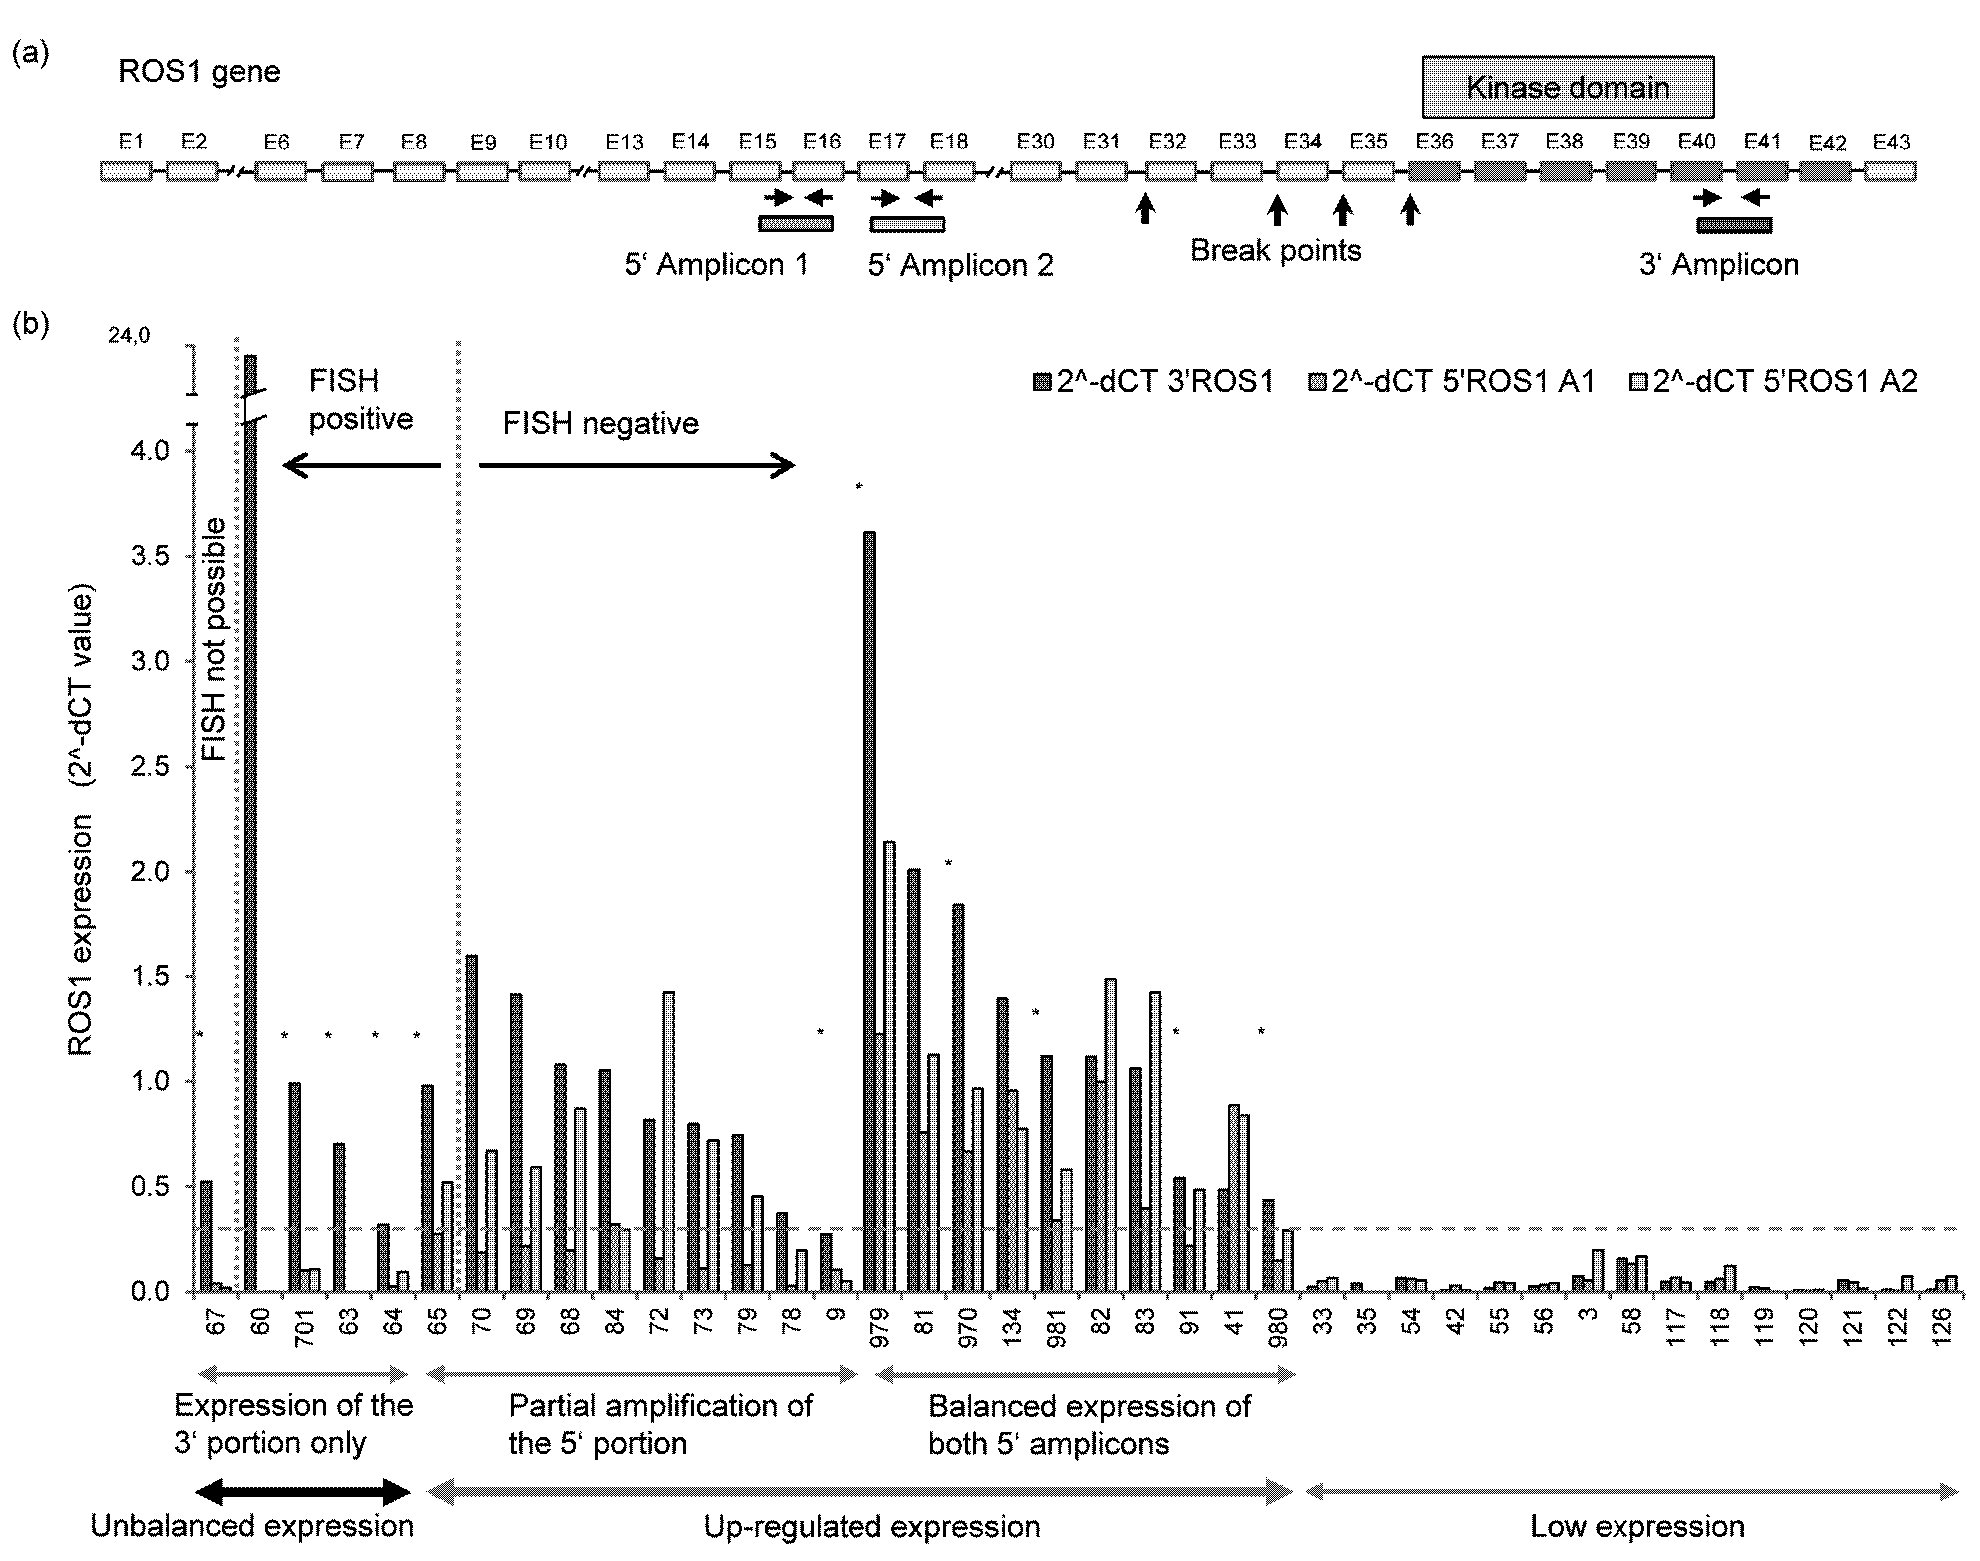
Screening for ROS1 rearrangements by qRT-PCR and correlation with FISH
The ROS1 qRT-PCR assay was applied to bronchoscopic biopsies and resection specimens from 695 NSCLC patients to screen for ROS1 rearrangements. 680 cases (98%) were interpretable. Tumor cell content was 15-70%. Upregulated gene expression was detected in 70 cases (10.3%): 50 tumors (7.4%) showed a balanced expression of the non-rearranged ROS1 transcript. In 15 cases (2.2%) a partial amplification of the 5' portion was observed (i.e. balanced amplification of one and unbalanced, low amplification of the second 5’ amplicon). The expression of the 3’ part ranged from 0.30 to 3.6 in the two groups. In a third group, 5/680 tumors (0.7%), an unbalanced ROS1 expression indicative of a gene rearrangement was observed: expression of the ROS1 3’ portion (range: 0.32-23.4), while the 5’ portion was not expressed (NSCLC #60, #701, #63, #64, #67) (Table 1, Figure 1). ROS1 was not expressed or at marginal levels in 610 samples (89.7%).
| Case # | Tumor cells [%] | EGFR statusa | ALK statusb | ROS1 qRT-PCRc | FISHd | IHC | Tanscript variantse | Kinase domain | ||||
| ROS1 3‘ | ROS1 5’-A1 | ROS1 5’-A2 | ratio 3’/5’-A1 | ratio 3’/5’-A2 | ROS1 break-apart probe | ROS1 | ||||||
| 60 | 50 | negative | negative | 23.38 | 0.00 | 0.00 | 36040.1 | 8641.9 | Translocation | 0 | n.d. | n.d. |
| 701 | 70 | negative | negative | 0.99 | 0.10 | 0.11 | 9.8 | 9.2 | Translocation | 3+ | n.d. | n.d. |
| 63 | 60 | negative | negative | 0.70 | 0.00 | 0.00 | 2190.9 | 533.9 | Translocation | 2+ | n.d. | n.d. |
| 64 | 15 | negative | negative | 0.32 | 0.03 | 0.10 | 11.6 | 3.3 | Translocation | 1+ | n.d. | n.d. |
| 67 | 40 | negative | negative | 0.53 | 0.04 | 0.02 | 12.9 | 25.5 | n.a. | 1+ | n.d. | n.d. |
| 65 | 30 | negative | n.d. | 0.98 | 0.28 | 0.52 | 3.5 | 1.9 | Translocation | 2+ | n.d. | n.d. |
| 374 | 70 | n.d. | n.d. | n.a. | n.a. | n.a. | n.a. | n.a. | Translocation | 2+ | n.d. | n.d. |
| 873 | 90 | negative | negative | n.a. | n.a. | n.a. | n.a. | n.a. | Translocation | 3+ | n.d. | n.d. |
| 70 | 40 | ex19 del | negative | 1.60 | 0.19 | 0.67 | 8.6 | 2.4 | wildtype | 0 | n.d. | wildtype |
| 69 | 10 | negative | negative | 1.41 | 0.22 | 0.59 | 6.5 | 2.4 | wildtype | 0 | 1, 5 | n.d. |
| 68 | 35 | negative | negative | 1.08 | 0.20 | 0.87 | 5.5 | 1.2 | wildtype | 0 | 1, 3, 4, 5 | n.d. |
| 84 | 80 | n.d. | negative | 1.05 | 0.32 | 0.30 | 3.3 | 3.5 | wildtype | 0 | 5 | wildtype |
| 71 | 10 | negative | negative | 0.98 | 0.08 | 1.15 | 12.4 | 0.9 | wildtype | 0 | 1, 5 | n.d. |
| 72 | 35 | ex19 del | negative | 0.82 | 0.16 | 1.42 | 5.1 | 0.6 | wildtype | 0 | n.d. | wildtype |
| 73 | 40 | negative | negative | 0.80 | 0.11 | 0.72 | 7.1 | 1.1 | wildtype | 0 | n.d. | wildtype |
| 74 | 10 | negative | negative | 0.77 | 0.06 | 0.37 | 13.5 | 2.1 | wildtype | 0 | n.d. | n.d. |
| 79 | 40 | negative | negative | 0.74 | 0.13 | 0.45 | 5.8 | 1.6 | wildtype | 0 | 1, 2, 4, 5 | n.d. |
| 75 | 40 | negative | negative | 0.60 | 0.15 | 0.43 | 4.1 | 1.4 | wildtype | 0 | n.d. | n.d. |
| 77 | 50 | negative | negative | 0.57 | 0.10 | 0.32 | 5.7 | 1.8 | wildtype | 0 | 1, 5 | n.d. |
| 76 | 10 | negative | n.d. | 0.54 | 0.10 | 0.39 | 5.4 | 1.4 | wildtype | 0 | n.d. | n.d. |
| 965 | 60 | negative | positive | 0.48 | 0.12 | 0.20 | 4.1 | 2.4 | n.d. | 0 | n.d. | n.d. |
| 78 | 60 | L861Q | negative | 0.37 | 0.03 | 0.20 | 12.4 | 1.9 | wildtype | 0 | n.d. | n.d. |
| 9 | 70 | negative | positive | 0.27 | 0.11 | 0.05 | 2.6 | 5.4 | wildtype | 1+ | 4, 5 | wildtype |
| 979 | 60 | L858R | negative | 3.61 | 1.22 | 2.14 | 3.0 | 1.7 | wildtype | 2+ | 4, 5 | wildtype |
| 970 | 30 | negative | positive | 1.84 | 0.67 | 0.96 | 2.8 | 1.9 | wildtype | 1+ | 5 | wildtype |
| 981 | 20 | G719X, S768I | negative | 1.12 | 0.34 | 0.58 | 3.3 | 1.9 | wildtype | 2+ | 4, 5 | wildtype |
| 91 | 25 | n.d. | negative | 0.54 | 0.22 | 0.49 | 2.4 | 1.1 | wildtype | 1+ | 1, 5 | wildtype |
| 980 | 50 | n.d. | negative | 0.44 | 0.15 | 0.29 | 2.9 | 1.5 | wildtype | 2+ | 4, 5, 6 | wildtype |
| 81 | 70 | n.d. | n.d. | 2.01 | 0.76 | 1.12 | 2.7 | 1.8 | wildtype | 0 | n.d. | wildtype |
| 82 | 50 | negative | negative | 1.12 | 1.00 | 1.48 | 1.1 | 0.8 | wildtype | 0 | n.d. | wildtype |
| 83 | 30 | L858R | negative | 1.06 | 0.40 | 1.42 | 2.7 | 0.7 | wildtype | 0 | n.d. | wildtype |
| 93 | 40 | negative | negative | 0.51 | 0.18 | 0.45 | 2.8 | 1.1 | wildtype | 0 | n.d. | wildtype |
| 41 | 70 | n.d. | negative | 0.41 | 0.89 | 0.84 | 0.5 | 0.6 | wildtype | 0 | n.d. | wildtype |
Abbreviations: n.d. = not determined; n.a. = data not analyzable; aEGFR status was determined by DNA sequence analysis of exons 18, 19, 21; bPositive refers to ALK rearrangement indicated by unbalanced ALK transcript expression and separated green and orange signals or single orange signals upon FISH; cROS1 transcript expression was measured by qRT-PCR amplification of the ROS1 5’ and 3’ portion: 3’ = 3’ amplicon exons 40/41; 5’-A1 = 5’ amplicon exons 15/16; 5’-A2 = 5’ amplicon exons 17/18; unbalanced expression 3’/5’-A1: ratio 3’/5’-A1 ≥3.5; unbalanced expression 3’/5’-A2: ratio 3’/5’-A2 ≥3.3; dTranslocation = ROS1 rearrangement indicated by separated green and orange signals or single green signals; eROS1 transcript variants: 1 = Del. Ex.8-16; 2= Del. Ex.13-17; 3 = Del. Ex.15-16; 4 = Del. Ex.18; 5 = r.2597-2598insCAG; 6 = r.1759del42; The table includes all NSCLC cases with ROS1 rearrangement, ROS1 protein expression and/or unbalanced ROS1 transcript expression (3’ expression >0.3), and 10/50 NSCLC with balanced transcript expression (3’ expression >0.3).
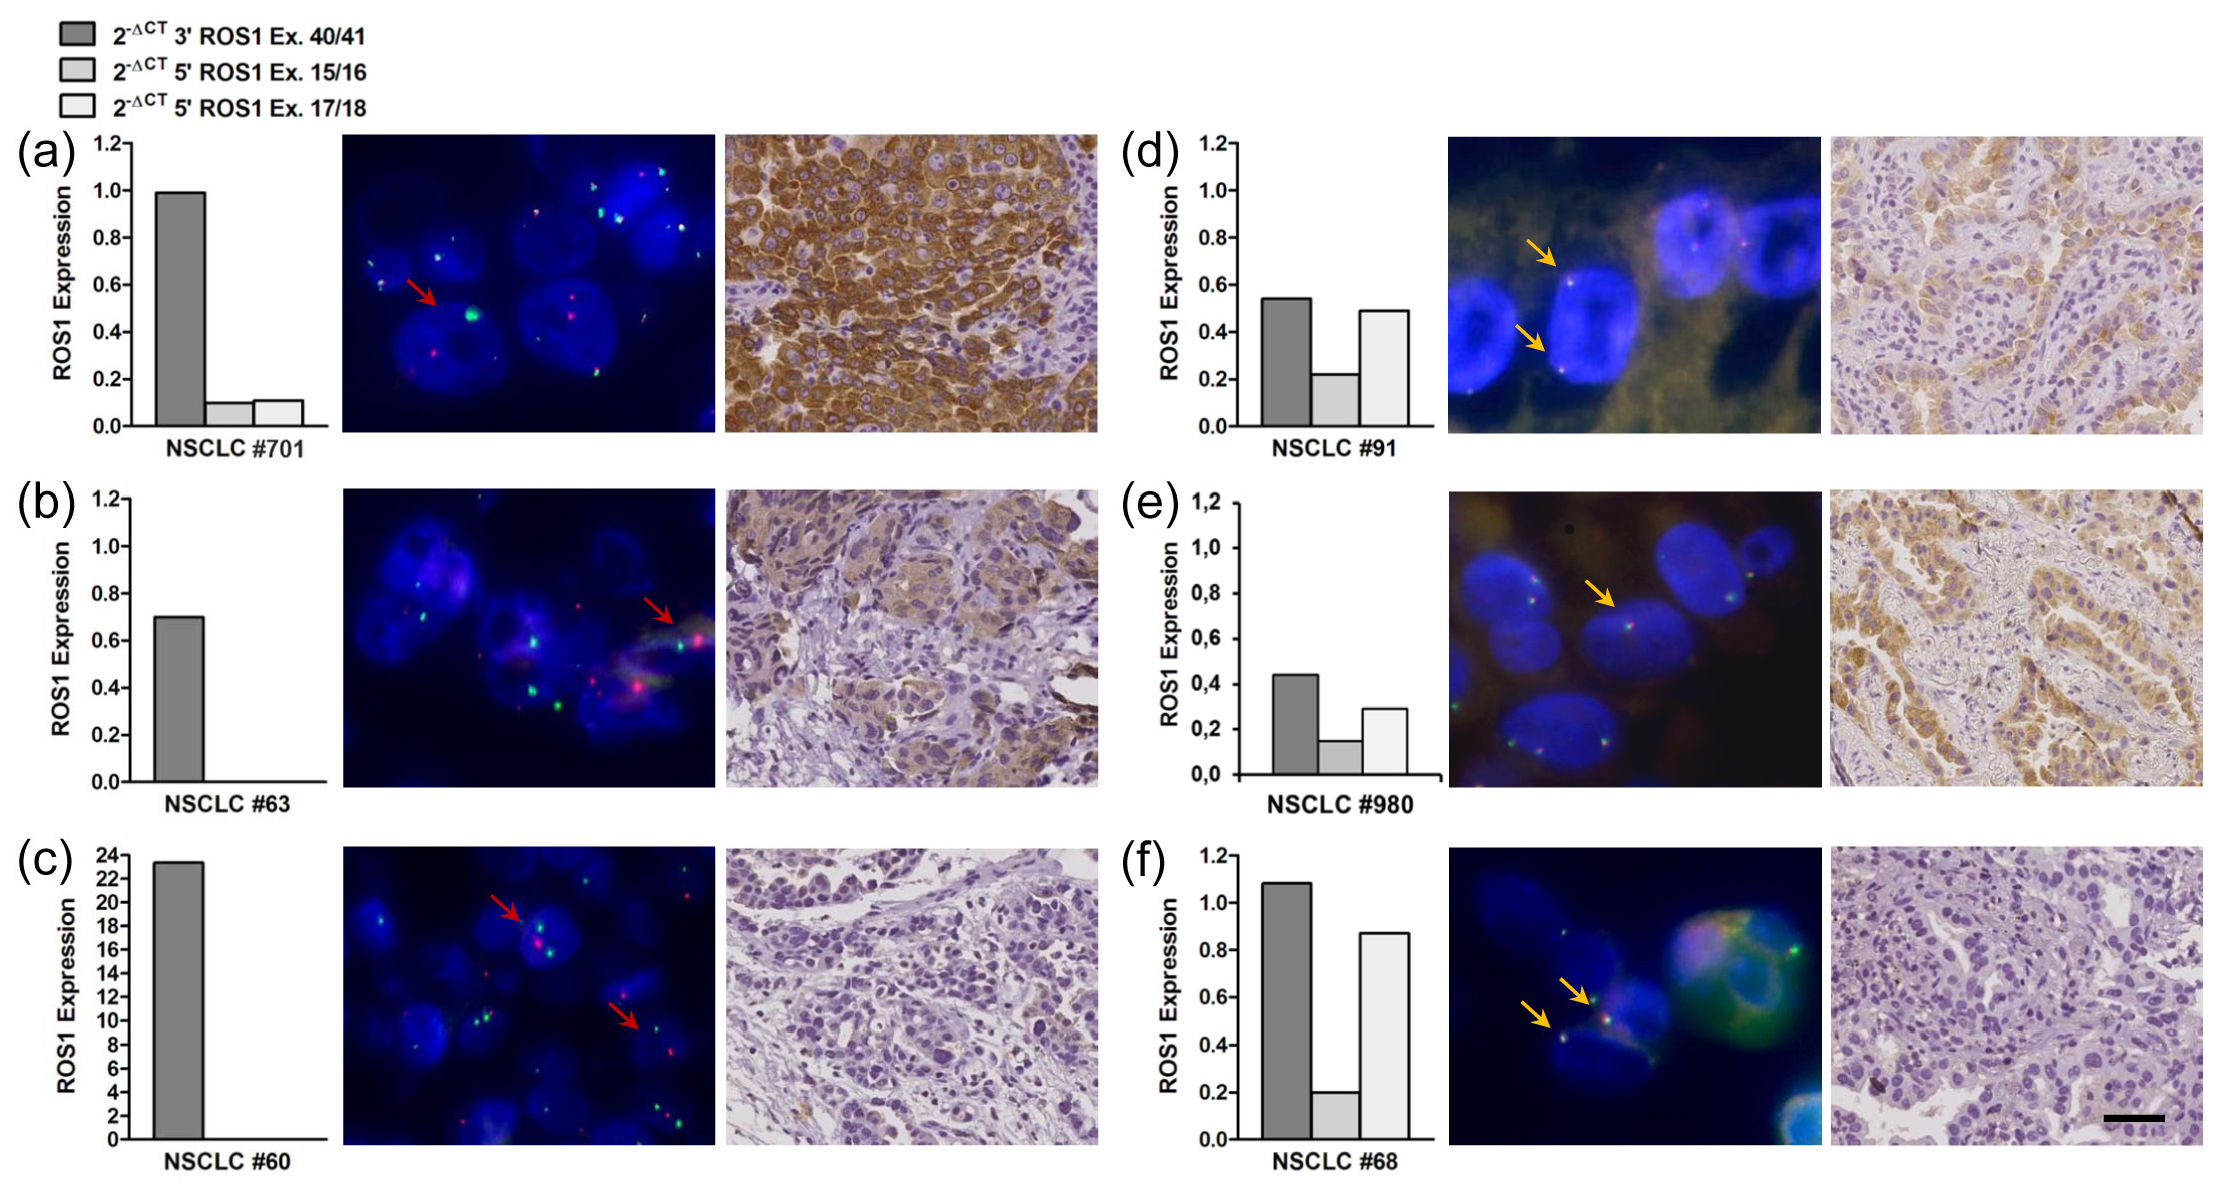
In order to relate ROS1 expression to ROS1 gene rearrangements, 127 samples characterized by qRT-PCR were subjected to FISH analysis. ROS1 break-apart FISH was interpretable in 99% (126/127) tumors including 4/5 tumors with unbalanced ROS1 expression. Of the latter, all four cases were confirmed to be ROS1 rearranged (Table 1, Figures 1 and 2). Of 14 tumors with partial amplification of the 5’ portion, 13 were not rearranged by FISH, whereas one case (#65) was rearranged. Although tumor #65 showed unbalanced, i.e. diminished amplification of both 5’ amplicons, only the 3’/5’-A1 ratio reached the threshold of unbalanced amplification of 3.5 (Table 1). Twenty tumors with balanced expression of non-rearranged ROS1 transcript and 88 qRT-PCR negative tumors were all negative for genomic ROS1 rearrangements. The qRT-PCR assay, therefore, accurately typed 99% (125/126) of tumors. In addition, it strongly suggested rearrangement of ROS1 in one tumor with unavailable FISH data (#67). In two cases with ROS1 rearrangement (#374, #873) detected by FISH screening of 44 further tumors qRT-PCR analysis was not interpretable due to poor RNA quality.
In seven tumors expressing non-rearranged ROS1, additional gene copies (3-4 ROS1 copies per cell) were detected in 22-30% tumor cells. A comparable genomic constellation, however, was observed in 10% of the 88 FISH negative cases without detectable expression of ROS1: 3-4 gene copies in 20-37% cells. More than four gene copies or gene amplification were not observed.
ROS1 protein expression in ROS1 rearranged vs. non-rearranged tumors
In total, 260 NSCLC were assessed for ROS1 protein expression. Immunostaining using the D4D6 antibody detected ROS1 protein overexpression in all but one of eight samples harboring a ROS1 rearrangement (Tables 1 and 2, Figure 2). Two ROS1 rearranged lung tumors showed strong immunostaining of the tumor cells, three cases were moderately positive, and two cases showed weak cytoplasmic staining. Of note, no ROS1 protein was detectable in the rearranged tumor with the by far highest expression of the 3’ portion of the ROS1 transcript (#60: 23.4), even if the fivefold concentration of antibody was employed. Of 35 samples with upregulated expression of non-rearranged ROS1 transcripts analyzed, ROS1 protein expression was detected in six tumors: three cases showed moderate and three tumors weak cytoplasmic staining (Tables 1 and 2, Figure 2). Expression levels of the ROS1 3’ portion did not necessarily correlate with the intensity of the immunohistochemical staining. Of importance, all 217 ROS1-negative tumors (non-rearranged tumors without ROS1 transcription) showed no staining with the ROS1 antibody.
| ROS1 Status | FISH | qRT-PCRb | n | Immunohistochemistry | |
| Positivec | Negative | ||||
| Rearranged | Positivea /n.d. | Unbalanced Expression both 5‘-Amplicons | 5 | 4 | 1 |
| Positivea | Partial 5’ Amplification | 1 | 1 | 0 | |
| Positivea | n.a. | 2 | 2 | 0 | |
| Non-rearranged | Negative/n.d. | Partial 5’ Amplification | 15 | 1d | 14 |
| Negative | Balanced Expression | 20 | 5 | 15 | |
| Negative/n.d. | Low/No Expression | 217 | 0 | 217 | |
| Total | 260 | 13 | 247 | ||
Abbreviations: n.d. = not determined; n.a. = data not analyzable; aPositive refers to ROS1 rearrangement indicated by separated green and orange signals or single green signals; bROS1 transcript expression was measured by qRT-PCR amplification of two ROS1 5’ amplicons (5’-A1; 5’-A2) and one 3’ amplicon: unbalanced expression both 5’ amplicons = ratios 3’/5’-A1 ≥3.5 and 3’/5’-A2 ≥3.3; partial 5’ amplification = 3’/5’-A1 ≥3.5 or 3’/5’-A2 ≥3.3; balanced expression = 3’/5’-A1 <3.5 and 3’/5’-A2 <3.3; low/no expression = 3’ <0.3. cPositive refers to weak, moderate or strong IHC staining in at least 10% tumor cells. dNSCLC #9: 3’ = 0.27, all other tumors with partial 5’ amplification: 3’>0.3.
Mutation analysis of the kinase region and the antibody binding epitope
ROS1 protein was not detectable by immunohistochemistry in one tumor harboring a gene rearrangement (#60) and in 80% NSCLC expressing non-rearranged ROS1. Therefore, we examined the recognition epitope of D4D6 (exon 43) for mutations in NSCLC #60 and six IHC negative cases with significant balanced transcript expression (#68, #73, #81, #82, #83, #93). In addition, we investigated the ROS1 kinase domain (exons 36-42) for activating mutations in 15 tumors with upregulated balanced gene expression, among them all six cases with ROS1 protein expression. However, point mutations were neither found in the kinase domain nor in the antibody recognition epitope (Table 1).
ROS1 transcript isoforms
Our observation of a partial VRT-PCR amplification of the ROS1 5’ portion in 15 cases raised the question about the expression of differentially spliced ROS1 isoforms in NSCLC tumor cells. As illustrated in Figure 3, systematic RT-PCR and sequence analysis of the ROS1 5’ portion (exons 1-18) identified six novel ROS1 isoforms expressed in NSCLC (LC119066-LC119071). With the exception of ROS1-3, all novel isoforms were found to be expressed in fetal lung, but not in non-malignant lung cells of adults.
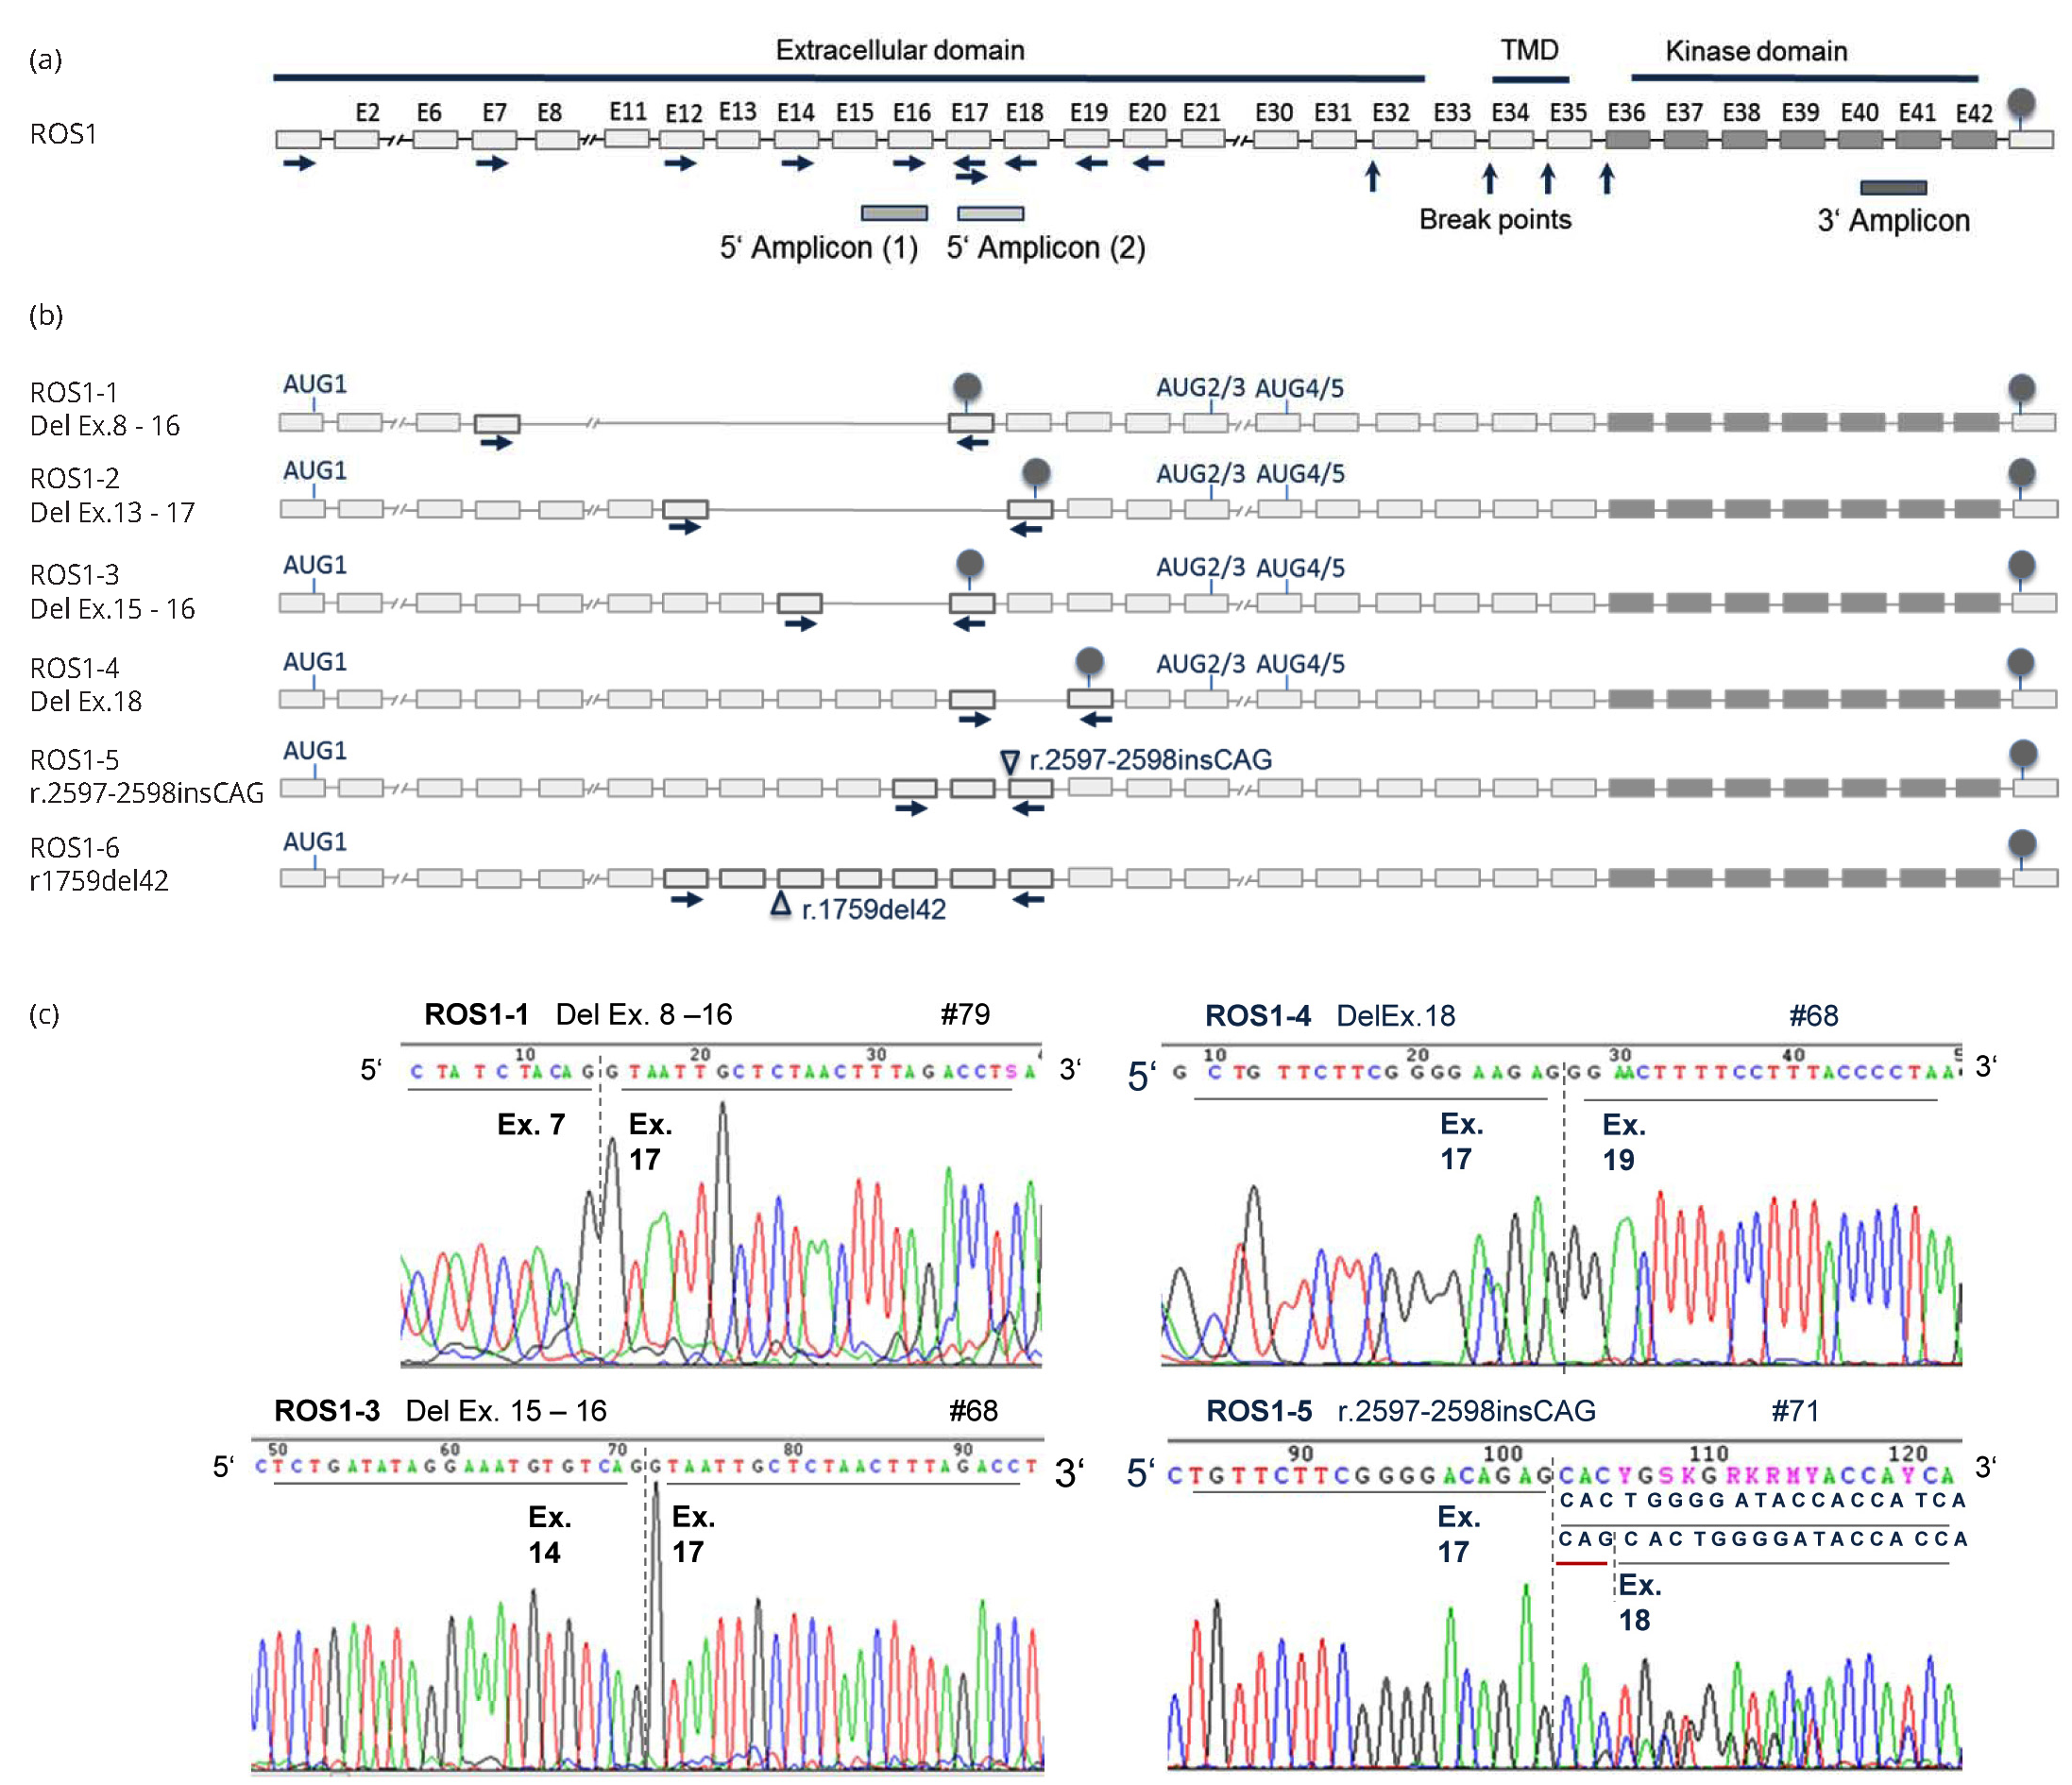
In splice variants ROS1-1 to ROS1-4 alternative splicing removed one to nine exons from the ROS1 5’ portion, which leads to frame-shift and premature translation truncation. The C-terminally truncated proteins simply contain the first 260-865 amino acids of the extracellular domain. Translational re-initiation or leaky scanning could mediate initiation at downstream AUGs [23, 24]. Concordantly, two independent algorithms (ATGpr_sim [21], NetStart 1.0 [22]) predicted four alternative translation initiation sites in exons 21, 23 and 30: AUG2, AUG3, AUG4, and AUG5 were in a good Kozak consensus, and the prediction scores were comparable to the conventional initiation site AUG1 in exon 1 (Table 3). In any case, alternative initiation may result in truncated proteins containing a small part of the extracellular region, the transmembrane region and the kinase domain. Note that the prediction of alternative initiation sites is based on our data integrated into the reference sequence (NM_002944.2); the characterization of full-length transcripts expressed in NSCLC cells was not possible, because this study was restricted to FFPE-derived RNA. Transcript ROS1-5 has an insertion at the exon 17 - exon 18 junction, which results in the insertion of one amino acid (p.Ser866_Thr867insSer). In ROS1-6 skipping of 42 bp from exon 13 leads to the loss of 14 amino acids from the extracellular region (p. Asn587>Ser, Val588_Gly601del). ROS1 protein expression was observed in the cytoplasm of six tumors expressing alternatively spliced transcripts ROS1-1, ROS1-4, ROS1-5, and/or ROS1-6 (Table 1, Figure 2). The C-terminal antibody D4D6, however, could not discriminate between translation products of these variants and of canonical ROS1 transcripts.
| AUG | ROS1 Exon | Position in NM_002944.2 | Identity to Kozak Rule A/GXXATGG | Reliability score ATGpr_sim | Prediction score NetStart 1.0 |
| AUG1 | 1 | 200 | GXXATGa | 0.25 | 0.420 |
| AUG2 | 21 | 3.551 | GXXATGa | 0.22 | 0.583 |
| AUG3 | 23 | 3.704 | GXXATGG | 0.16 | 0.690 |
| AUG4 | 30 | 5.126 | GXXATGt | 0.20 | 0.540 |
| AUG5 | 30 | 5.162 | GXXATGt | 0.16 | 0.519 |
Note: AUG1 is known as the conventional initiation site for ROS1 translation; AUG2, AUG3, AUG4, and AUG5 were predicted by ATGpr_sim and NetStart 1.0.
In all twelve tumors analyzed, diminished qRT-PCR amplification of one or both 5’ amplicons was attributable to expression of transcripts ROS1-1 to ROS1-5: Six tumors with unbalanced 3’/5’-A1 amplification expressed ROS1-1, ROS-2, and/or ROS1-3, which all lack the binding sites for 5’-A1 in exons 15/16 (Table 1). ROS1-4 and ROS1-5 impede amplification of 5’-A2, especially in cases #9 and #84. ROS1-5 was detected in all twelve tumors, but in only 10-30% of ROS1 transcripts, and thus had only limited influence on 5’-A2 amplification.
Molecular analysis of other RTK
As detailed in Table 1, all ROS1-rearranged tumors analyzed were wildtype for EGFR and ALK. Upregulation of ROS1 transcription recurrently occurred in conjunction with EGFR or ALK activation (EGFR mutation in 6/20 NSCLC, ALK rearrangement in 3/23 NSCLC). Altogether, 4/6 NSCLC expressing ROS1 protein independent of gene rearrangement harbored coexisting EGFR mutation or ALK translocation.
DiscussionTop
Genomic rearrangements of ROS1 lead to overexpression of the 3’ part of the gene encoding the kinase domain, while the ROS1 5’ portion remains unexpressed. We constructed a diagnostic test that reliably detected ROS1 rearrangements in FFPE tissues by recognizing an unbalanced ROS1 transcript expression independent of the fusion partner.
The qRT-PCR assay identified ROS1 rearrangement in 0.7% of 680 NSCLC and upregulated balanced transcript expression in 9.6% tumors. The qRT-PCR accurately typed 99% of the tumors (four ROS1-rearranged and 121 non-rearranged cases) and strongly suggested rearrangement in one case with insufficient FISH results. The only discrepant case was positive on FISH and IHC, but judged negative by qRT-PCR: despite diminished amplification of both 5’ amplicons only one reached the threshold of unbalanced amplification. Obviously, expression of non-rearranged ROS1 in addition to the fusion gene gave rise to a significant amount of transcripts containing the ROS1 5’ portion. While tumors expressing only fusion transcripts are identified without doubt by lack of expression of both 5’ amplicons, simultaneous expression of rearranged and non-rearranged transcripts bears the risk of false-negative results which, however, would be minimized by re-examination of critical cases with low ratios (3’/5’-A1, 3’/5’-A2: 1.5-4.0) – 17/680 cases (2.5%) in our series - by alternative assays such as FISH.
FISH is the approved diagnostic test to detect ROS1 translocation. However, the labor-intensive, low-throughput nature of FISH makes screening for fusion genes in large cohorts cumbersome and drives the search for more efficient diagnostic approaches, such as transcript-based methods. Recent reports have highlighted the principal potential of 3 overexpression strategies to detect ALK, ROS1 and RET rearrangements. Most of these approaches, however, are of limited utility in routine diagnostics using FFPE material. The qRT-PCR assay developed by Wang and colleagues detected rearrangements in frozen tissue samples with excellent sensitivity, but had not been adapted to FFPE specimens [25]. Alternative technologies, based on exon array analyses or NanoString nCounter technology are highly sensitive for the detection of fusion transcripts, but are not readily available in diagnostic laboratories [26, 28]. In contrast, our approach is an inexpensive, rapid and relatively high-throughput technique with easy-to-use protocols. In addition, small biopsy fragments of low tumor cell content will suffice for diagnosis: ROS1 expression was reliably detected in resection specimens as well as in biopsies with as few as 15% tumor cells. ALK [16] and ROS1 qRT-PCR testing can be perfectly combined; and by employing the extraction method used here RNA and DNA can be isolated simultaneously from the same specimen, which opens up the possibility to perform DNA mutation analysis in parallel to optimize tissue processing.
The sensitivity of ROS1 immunostaining for rearrangements was reported to be 100% [9, 14] and, as such, IHC was suggested as an effective screening tool in NSCLC. However, ROS1 is more often expressed in NSCLC without concomitant translocation (4-30% NSCLC) [9, 10, 13, 15]. Accordingly, ROS1 protein expression was restricted to tumors that harbored ROS1 rearrangements or overexpressed non-rearranged ROS1 transcripts in our study. Screening for ROS1 protein expressing cases, therefore, will have to be complemented by qRT-PCR or FISH.
Paradoxically, ROS1 protein was not detected in one rearranged tumor with the by far highest expression of the 3’ portion of the ROS1 transcript. As direct cause, mutation of the recognition epitope of D4D6 could be excluded, while fusion to a rare partner with tightly regulated translation is possible. Whether the absence of ROS1 fusion protein impedes treatment with the kinase inhibitor remains unsolved. Our index patient did not undergo crizotinib therapy.
Upregulated ROS1 transcript expression independent of translocation was observed in 9.6% of NSCLC specimens. This is in line with previous studies, which demonstrated that ROS1 is aberrantly expressed in 20-30% of NSCLC [29, 30], but also in 33-56% of glioblastomas, up to 55% of meningiomas [1] and 70% of chronic myelomonocytic leukemia (CMML) [31]. Increasing evidence shows that deregulated expression of ROS1 is of importance in cancer development. First, ROS1 expression has been shown to have transforming activity and to reduce cell adhesion and apoptosis via downstream signaling in cancer associated pathways involving protein kinases ERK1/2, PI3K, AKT, and STAT3 and VAV3 signaling pathways [1]. Second, in carcinogen-induced murine lung adenocarcinoma and rat stomach cancer ROS1 expression was induced upon carcinogen treatment and persisted long after chemical exposure, leading the authors to suggest that this persistent change was one of the drivers of tumorigenesis [32, 33]. Third, elevated ROS1 expression was observed in NSCLC in an oncogenic KRAS initiated mouse model, suggesting that in these tumors ROS1 may work in concert with activated KRAS to establish signaling pathways with transforming activities [34].
Very recently, gene amplification was discussed as a further mechanism of ROS1 gene activation in lung cancer by Jin et al., who reported on gains of at least four copies per nucleus in 4.8% NSCLC [10]. In our series, ROS1 was present in up to four gene copies making gene amplification an unlikely event to account for the observed aberrant expression. Ectopic protein expression may rather be caused by epigenetic changes as recently observed for ROS1 in NSCLC cells by Lee et al. [15].
It is well known that an altered balance of splice isoforms or expression of aberrant oncogenic splice variants contributes to tumorigenesis in a wide range of cancers [35, 36]. Alternative splicing was recently shown to be involved in the regulation of the Ras-MAPK and PI3K-mTOR signaling pathways: EGFR, FGFR, INSR, VEGFR, MET, RON can be alternatively spliced to generate soluble truncated isoforms which act in a dominant-negative manner or constitutively active RTKs which are active regardless of ligand binding [37]. Here, we demonstrate for the first time that upregulated ROS1 transcription is associated with alternative splicing. We identified six alternatively spliced transcripts in NSCLC cells, which with only one exception (ROS1-3) all were also expressed in fetal lung, but not in non-malignant adult lung cells. The aberrant expression of fetal transcripts in tumor cells likely confers tumorigenic activity by creating N-terminal and C-terminal ROS1 isoforms and ROS1 with modified extracellular domains: (i) Two transcript variants lead to structural modification of the extracellular domain: In-frame insertion of one serine (ROS1-5) or deletion of 42 amino acids (ROS1-6). Comparable to ROS1-6, isoforms of EGFR (de4EGFR, exon 4 skipped) and RON (deltaRon, exon 11 skipped) lack a portion of the extracellular ligand-binding domain. Both isoforms undergo ligand-independent activation involved in tumorigenesis: de4EGFR induces transformation and promotes metastasis [37, 38], deltaRon confers increased motility [39]. Similarly, ROS1 isoforms with modified extracellular domains likely act tumorigenic via ligand-independent ROS1 activation. (ii) In four ROS1 variants (ROS1-1 to ROS1-4), skipping of one to nine exons from the ROS1 5’ portion resulted in frame-shift and premature translation truncation. The C-terminal isoforms lack the anchoring transmembrane domain and the kinase domain and may inactivate co-expressed wildtype ROS1. Comparable truncated isoforms of EGFR [40] and VEGFR2 [41], also containing only the extracellular domain, act as dominant-negative regulators in several human cancers by titrating out the ligand or by trapping the wildtype receptors in nonfunctional heterodimers. (iii) Alternatively, ROS1-1 to ROS1-4 transcripts may give rise to N-terminal proteins via alternative translation initiation at downstream AUGs - as shown for N-terminal TP53 splice variants (D133-p53, D40-p53) expressed in melanoma and breast cancer [35]. Two independent algorithms predicted alternative translation initiation sites in ROS1 exons 21, 23 and 30. In any case, the predicted N-terminal ROS1 isoforms contain a small part of the extracellular region, the transmembrane and the kinase domain. These isoforms resemble the tumor-specific EGFR variant EGFRvIII which lacks a portion of the extracellular ligand-binding domain due to an inframe deletion of exons 2-7 [42]. EGFRvIII is constitutively active in a ligand-independent manner and confers growth advantage to cancer cells [37, 38]. Deletion of the extracellular domain leading to ligand-independent activation may be an important event in the oncogenic activation of ROS1: In contrast to all other RTKs, ROS1 creates oncogenic fusion proteins with partners that do not contain protein dimerization domains [1], indicating that not homodimerization but rather decoupling from ligand control promotes constitutive ROS1 activation.
ROS1 protein was observed in 6/35 tumors with upregulated gene expression, all of them expressing alternatively spliced transcripts: ROS1-1, ROS1-4, ROS1-5, and/or ROS1-6. The C-terminal antibody D4D6 detected ROS1 molecules containing the kinase domain; it could not discriminate between N-terminal isoforms (ROS1-1N, ROS1-4N), isoforms with modified extracellular domains (ROS1-5, ROS1-6) and canonical ROS1. In addition, D4D6 was not able to detect C-terminal isoforms. Therefore, we cannot presently assess the relative impact of isoform expression on ROS1 function. We provide first evidence, however, for alternatively spliced ROS1 transcripts, while the contribution of ROS1 splicing in human disease remains to be fully explored.
In 4/6 cases, ROS1 protein from a non-rearranged gene was co-expressed with mutant EGFR or rearranged ALK, thus possibly contributing to the development of tumors that are predominately addicted to EGFR and ALK signaling. Given a responsiveness of ROS1 overexpressing tumors to inhibitors such as crizotinib, we speculate that (i) lung cancer patients with simultaneous ROS1 and EGFR activation may profit from combined therapy. In this regard, a recent study [43] showed that ROS1 overexpression mediated resistance to gefitinib in glioblastoma cells, but that combined treatment with gefitinib and a ROS1 inhibitor induced massive cell death by apoptosis. (ii) In cases with simultaneous ALK/ROS1 activation, treatment with mono ALK next-generation inhibitors instead of the dual ALK/ROS1 inhibitor crizotinib may decrease treatment efficiency.
ConclusionTop
The main findings of this study are that (i) a subgroup of NSCLC expresses alternatively spliced ROS1 transcripts which may be relevant for ROS1 inhibitor therapy; (ii) IHC is a suitable screening tool for selecting ROS1 positive NSCLC, but unless the role of upregulated ROS1 expression for inhibitor therapy is solved, re-examination of ROS1 protein expressing cases by qRT-PCR or FISH is compulsory; (iii) the qRT-PCR approach presented here reliably detects ROS1-rearranged tumors independent of the fusion partner and also identifies cases with non-rearranged transcript expression not detectable by FISH. Thus, qRT-PCR is a sensitive technique suitable for the routine diagnosis of ROS1 activation not only in lung cancer, but also in other tumor entities where rearrangements with alternative fusion partners (glioblastoma, cancers of stomach, liver, kidney, colon) or transcriptional upregulation of ROS1 (meningioma, CMML) are prevalent.
Acknowledgments
The authors thank Katja Bräutigam and Daniela Pumm for expert technical assistance.
Funding
This study was supported by the Robert Bosch Foundation, Stuttgart, Germany (KKF 13-9).
Conflicts of interest
The authors declare no conflict of interest.
Supplementary dataTop
ReferencesTop
[1]Acquaviva J, Wong R, Charest A. The multifaceted roles of the receptor tyrosine kinase ROS in development and cancer. Biochim Biophys Acta. 2009; 1795(1):37–52.Article Pubmed
[2]Rikova K, Guo A, Zeng Q, Possemato A, Yu J, et al. Global survey of phosphotyrosine signaling identifies oncogenic kinases in lung cancer. Cell. 2007; 131(6):1190–1203.Article Pubmed
[3]Takeuchi K, Soda M, Togashi Y, Suzuki R, Sakata S, et al. RET, ROS1 and ALK fusions in lung cancer. Nat Med. 18(3):378–381.Article Pubmed
[4]Davies KD, Doebele RC. Molecular pathways: ROS1 fusion proteins in cancer. Clin Cancer Res. 2013; 19(15):4040–4045.Article Pubmed
[5]Bergethon K, Shaw AT, Ou S-HI, Katayama R, Lovly CM, et al. ROS1 rearrangements define a unique molecular class of lung cancers. J Clin Oncol. 2012; 30(8):863–870.Article Pubmed
[6]Yasuda H, de Figueiredo-Pontes LL, Kobayashi S, Costa DB. Preclinical rationale for use of the clinically available multitargeted tyrosine kinase inhibitor crizotinib in ROS1-translocated lung cancer. J Thorac Oncol. 2012; 7(7):1086–1090.Article Pubmed
[7]Shaw AT, Ou S-HI, Bang YJ, Camidge DR, Solomon BJ, et al. Crizotinib in ROS1-rearranged non–small-cell lung cancer. N Engl J Med. 2014; 371(21):1963–1971.Article Pubmed
[8]Gainor JF, Shaw AT. Novel targets in non-small cell lung cancer: ROS1 and RET fusions. Oncologist. 2013; 18(7):865–875.Article Pubmed
[9]Warth A, Muley T, Dienemann H, Goeppert B, Stenzinger A, et al. ROS1 expression and translocations in non-small-cell lung cancer: clinicopathological analysis of 1478 cases. Histopathology. 2014; 65(2):187–194.Article Pubmed
[10]Jin Y, Sun PL, Kim H, Park E, Shim HS, et al. ROS1 gene rearrangement and copy number gain in non-small cell lung cancer. Virchows Arch. 2015; 466(1):45–52.Article Pubmed
[11]Sholl LM, Sun H, Butaney M, Zhang C, Lee C, et al. ROS1 immunohistochemistry for detection of ros1-rearranged lung adenocarcinomas. Am J Surg Pathol. 2013; 37(9):1441-1449.Article Pubmed
[12]Mescam-Mancini L, Lantuéjoul S, Moro-Sibilot D, Rouquette I, Souquet PJ, et al. On the relevance of a testing algorithm for the detection of ROS1-rearranged lung adenocarcinomas. Lung Cancer. 2014; 83(2):168–173.Article Pubmed
[13]Yoshida A, Tsuta K, Wakai S, Arai Y, Asamura H, et al. Immunohistochemical detection of ROS1 is useful for identifying ROS1 rearrangements in lung cancers. Mod Pathol. 2014; 27(5):711–720.Article Pubmed
[14]Rimkunas VM, Crosby KE, Li D, Hu Y, Kelly ME, et al. Analysis of receptor tyrosine kinase ROS1-positive tumors in non–small cell lung cancer: identification of a FIG-ROS1 fusion. Clin Cancer Res. 2012; 18(16):4449–4457.Article Pubmed
[15]Lee HJ, Seol HS, Kim JY, Chun SM, Suh YA, et al. ROS1 receptor tyrosine kinase, a druggable target, is frequently overexpressed in non-small cell lung carcinomas via genetic and epigenetic mechanisms. Ann Surg Oncol. 2013; 20(1):200–208.Article Pubmed
[16]Gruber K, Horn H, Kalla J, Fritz P, Rosenwald A, et al. Detection of rearrangements and transcriptional up-regulation of ALK in FFPE lung cancer specimens using a novel, sensitive, quantitative reverse transcription polymerase chain reaction assay. J Thorac Oncol. 2014; 9(3):307–315.Article Pubmed
[17]Travis WD, Brambilla E, Noguchi M, Nicholson AG, Geisinger KR, et al. International association for the study of lung cancer/american thoracic society/european respiratory society international multidisciplinary classification of lung adenocarcinoma. J Thorac Oncol. 2011; 6(2):244–285.Article Pubmed
[18]Brown LA, Huntsman D. Fluorescent in situ hybridization on tissue microarrays: challenges and solutions. J Mol Histol. 2007; 38(2):151–157.Article Pubmed
[19]Lynch TJ, Bell DW, Sordella R, Gurubhagavatula S, Okimoto RA, et al. Activating mutations in the epidermal growth factor receptor underlying responsiveness of non-small-cell lung cancer to gefitinib. N Engl J Med. 2004; 350(21):2129–2139.Article Pubmed
[20]Paez JG, Jänne PA, Lee JC, Tracy S, Greulich H, et al. EGFR mutations in lung cancer: correlation with clinical response to gefitinib therapy. Science. 2004; 304(5676):1497–1500.Article Pubmed
[21]Nishikawa T, Ota T, Isogai T. Prediction whether a human cDNA sequence contains initiation codon by combining statistical information and similarity with protein sequences. Bioinforma. 2000; 16(11):960–967.Article Pubmed
[22]Pedersen AG, Nielsen H. Neural network prediction of translation initiation sites in eukaryotes: perspectives for EST and genome analysis. Proc Int Conf Intell Syst Mol Biol. 1997; 5:226–233.Article Pubmed
[23]Kozak M. Pushing the limits of the scanning mechanism for initiation of translation. Gene. 2002; 299(1–2):1–34.Article Pubmed
[24]Jackson RJ, Hellen CUT, Pestova TV. The mechanism of eukaryotic translation initiation and principles of its regulation. Nat Rev Mol Cell Biol. 2010; 11(2):113–127.Article Pubmed
[25]Wang R, Pan Y, Li C, Hu H, Zhang Y, et al. The use of quantitative real-time reverse transcriptase PCR for 5’ and 3’ portions of ALK transcripts to detect ALK rearrangements in lung cancers. Clin Cancer Res. 2012; 18(17):4725–4732.Article Pubmed
[26]Koivunen JP, Mermel C, Zejnullahu K, Murphy C, Lifshits E, et al. EML4-ALK fusion gene and efficacy of an ALK kinase inhibitor in lung cancer. Clin Cancer Res. 2008; 14(13):4275–4283.Article Pubmed
[27]Lira ME, Kim TM, Huang D, Deng S, Koh Y, et al. Multiplexed Gene Expression and Fusion Transcript Analysis to Detect ALK Fusions in Lung Cancer. J Mol Diagn. 2013; 15(1):51–61.Article Pubmed
[28]Suehara Y, Arcila M, Wang L, Hasanovic A, Ang D, et al. Identification of KIF5B-RET and GOPC-ROS1 fusions in lung adenocarcinomas through a comprehensive mRNA-based screen for tyrosine kinase fusions. Clin Cancer Res. 2012; 18(24):6599–6608.Article Pubmed
[29]Bhattacharjee A, Richards WG, Staunton J, Li C, Monti S, et al. Classification of human lung carcinomas by mRNA expression profiling reveals distinct adenocarcinoma subclasses. Proc Natl Acad Sci U S A. 2001; 98(24):13790–13795.Article Pubmed
[30]Garber ME, Troyanskaya OG, Schluens K, Petersen S, Thaesler Z, et al. Diversity of gene expression in adenocarcinoma of the lung. Proc Natl Acad Sci U S A. 2001; 98(24):13784–13789.Article Pubmed
[31]Cilloni D, Carturan S, Bracco E, Campia V, Rosso V, et al. Aberrant activation of ROS1 represents a new molecular defect in chronic myelomonocytic leukemia. Leuk Res. 2013; 37(5):520–530.Article Pubmed
[32]Bonner AE, Lemon WJ, Devereux TR, Lubet RA, You M. Molecular profiling of mouse lung tumors: association with tumor progression, lung development, and human lung adenocarcinomas. Oncogene. 2004; 23(5):1166–1176.Article Pubmed
[33]Yamashita S, Nomoto T, Abe M, Tatematsu M, Sugimura T, et al. Persistence of gene expression changes in stomach mucosae induced by short-term N-methyl-N’-nitro-N-nitrosoguanidine treatment and their presence in stomach cancers. Mutat Res. 2004; 549(1–2):185–193.Article Pubmed
[34]Sweet-Cordero A, Mukherjee S, Subramanian A, You H, Roix JJ, et al. An oncogenic KRAS2 expression signature identified by cross-species gene-expression analysis. Nat Genet. 2005; 37(1):48–55.Article Pubmed
[35]Chen J, Weiss WA. Alternative splicing in cancer: implications for biology and therapy. Oncogene. 2015; 34(1):1–14.Article Pubmed
[36]Pagliarini V, Naro C, Sette C. Splicing regulation: A molecular device to enhance cancer cell adaptation. Biomed Res Int. 2015; 2015:543067.Article Pubmed
[37]Siegfried Z, Bonomi S, Ghigna C, Karni R. Regulation of the Ras-MAPK and PI3K-mTOR signalling pathways by alternative splicing in cancer. Int J Cell Biol. 2013; 2013:568931.Article Pubmed
[38]Nishikawa R, Ji XD, Harmon RC, Lazar CS, Gill GN, et al. A mutant epidermal growth factor receptor common in human glioma confers enhanced tumorigenicity. Proc Natl Acad Sci U S A. 1994; 91(16):7727–7731.Article Pubmed
[39]Ghigna C, Giordano S, Shen H, Benvenuto F, Castiglioni F, et al. Cell motility is controlled by SF2/ASF through alternative splicing of the Ron protooncogene. Mol Cell. 2005; 20(6):881–890.Article Pubmed
[40]Reiter JL, Threadgill DW, Eley GD, Strunk KE, Danielsen AJ, et al. Comparative genomic sequence analysis and isolation of human and mouse alternative EGFR transcripts encoding truncated receptor isoforms. Genomics. 2001; 71(1):1–20.Article Pubmed
[41]Vorlová S, Rocco G, Lefave CV, Jodelka FM, Hess K, et al. Induction of antagonistic soluble decoy receptor tyrosine kinases by intronic polyA activation. Mol Cell. 2011; 43(6):927–939.Article Pubmed
[42]Gan HK, Cvrljevic AN, Johns TG. The epidermal growth factor receptor variant III (EGFRvIII): where wild things are altered. FEBS J. 2013; 280(21):5350–5370.Article Pubmed
[43]Aljohani H, Koncar RF, Zarzour A, Park BS, Lee SH, et al. ROS1 amplification mediates resistance to gefitinib in glioblastoma cells. Oncotarget. 2015; 6(24):20388–20395.Article Pubmed
 Copyright
© 2012-2025 NobleResearch Group. All Rights Reserved
Copyright
© 2012-2025 NobleResearch Group. All Rights Reserved